Question 100 market efficiency, technical analysis, joint hypothesis problem
A company selling charting and technical analysis software claims that independent academic studies have shown that its software makes significantly positive abnormal returns. Assuming the claim is true, which statement(s) are correct?
(I) Weak form market efficiency is broken.
(II) Semi-strong form market efficiency is broken.
(III) Strong form market efficiency is broken.
(IV) The asset pricing model used to measure the abnormal returns (such as the CAPM) had mis-specification error so the returns may not be abnormal but rather fair for the level of risk.
Select the most correct response:
A project's Profitability Index (PI) is less than 1. Select the most correct statement:
A fairly priced stock has a beta that is the same as the market portfolio's beta. Treasury bonds yield 5% pa and the market portfolio's expected return is 10% pa. What is the expected return of the stock?
The following table shows a sample of historical total returns of shares in two different companies A and B.
| Stock Returns | ||
| Total effective annual returns | ||
| Year | ##r_A## | ##r_B## |
| 2007 | 0.2 | 0.4 |
| 2008 | 0.04 | -0.2 |
| 2009 | -0.1 | -0.3 |
| 2010 | 0.18 | 0.5 |
What is the historical sample covariance (##\hat{\sigma}_{A,B}##) and correlation (##\rho_{A,B}##) of stock A and B's total effective annual returns?
Which of the following statements about the weighted average cost of capital (WACC) is NOT correct?
Question 385 Merton model of corporate debt, real option, option
A risky firm will last for one period only (t=0 to 1), then it will be liquidated. So it's assets will be sold and the debt holders and equity holders will be paid out in that order. The firm has the following quantities:
##V## = Market value of assets.
##E## = Market value of (levered) equity.
##D## = Market value of zero coupon bonds.
##F_1## = Total face value of zero coupon bonds which is promised to be paid in one year.
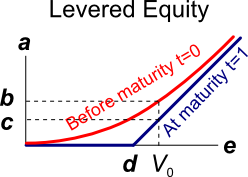
The levered equity graph above contains bold labels a to e. Which of the following statements about those labels is NOT correct?
A stock's returns are normally distributed with a mean of 8% pa and a standard deviation of 15 percentage points pa. What is the 99% confidence interval of returns over the next year? Note that the Z-statistic corresponding to a one-tail:
- 90% normal probability density function is 1.282.
- 95% normal probability density function is 1.645.
- 97.5% normal probability density function is 1.960.
- 99% normal probability density function is 2.326.
- 99.5% normal probability density function is 2.576
The 99% confidence interval of annual returns is between: