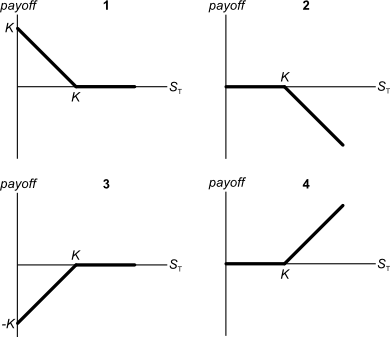
Below are 4 option graphs. Note that the y-axis is payoff at maturity (T). What options do they depict? List them in the order that they are numbered.
A company has:
- 100 million ordinary shares outstanding which are trading at a price of $5 each. Market analysts estimated that the company's ordinary stock has a beta of 1.5. The risk-free rate is 5% and the market return is 10%.
- 1 million preferred shares which have a face (or par) value of $100 and pay a constant annual dividend of 9% of par. The next dividend will be paid in one year. Assume that all preference dividends will be paid when promised. They currently trade at a price of $90 each.
- Debentures that have a total face value of $200 million and a yield to maturity of 6% per annum. They are publicly traded and their market price is equal to 110% of their face value.
The corporate tax rate is 30%. All returns and yields are given as effective annual rates.
What is the company's after-tax Weighted Average Cost of Capital (WACC)? Assume a classical tax system.
A project's Profitability Index (PI) is less than 1. Select the most correct statement:
Which one of the following bonds is trading at par?
A stock just paid a dividend of $1. Future annual dividends are expected to grow by 2% pa. The next dividend of $1.02 (=1*(1+0.02)^1) will be in one year, and the year after that the dividend will be $1.0404 (=1*(1+0.02)^2), and so on forever.
Its required total return is 10% pa. The total required return and growth rate of dividends are given as effective annual rates.
Calculate the current stock price.
Which of the following statements about futures contracts on shares is NOT correct, assuming that markets are efficient?
When an equity future is first negotiated (at t=0):
Which of the below formulas gives the profit ##(\pi)## from being long a call option? Let the underlying asset price at maturity be ##S_T##, the exercise price be ##X_T## and the option price be ##f_{LC,0}##. Note that ##S_T##, ##X_T## and ##f_{LC,0}## are all positive numbers.
A share’s current price is $60. It’s expected to pay a dividend of $1.50 in one year. The growth rate of the dividend is 0.5% pa and the stock’s required total return is 3% pa. The stock’s price can be modeled using the dividend discount model (DDM):
##P_0=\dfrac{C_1}{r-g}##
Which of the following methods is NOT equal to the stock’s expected price in one year and six months (t=1.5 years)? Note that the symbolic formulas shown in each line below do equal the formulas with numbers. The formula is just repeated with symbols and then numbers in case it helps you to identify the incorrect statement more quickly.
Question 897 comparative advantage in trade, production possibilities curve, no explanation
Adam and Bella are the only people on a remote island. Their production possibility curves are shown in the graph.
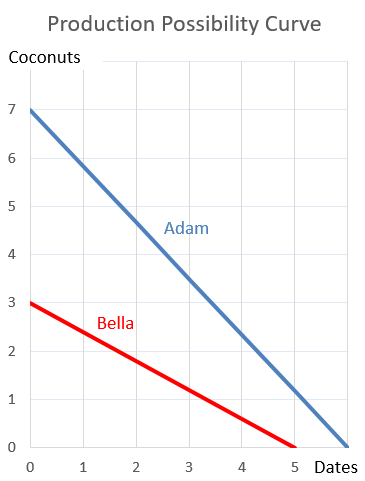
Which of the following statements is NOT correct?