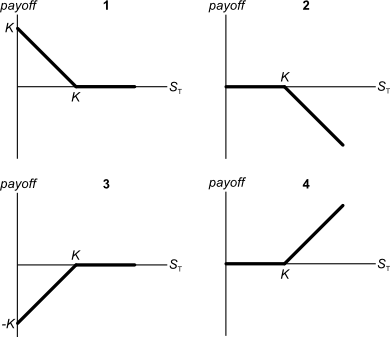
Below are 4 option graphs. Note that the y-axis is payoff at maturity (T). What options do they depict? List them in the order that they are numbered.
A student just won the lottery. She won $1 million in cash after tax. She is trying to calculate how much she can spend per month for the rest of her life. She assumes that she will live for another 60 years. She wants to withdraw equal amounts at the beginning of every month, starting right now.
All of the cash is currently sitting in a bank account which pays interest at a rate of 6% pa, given as an APR compounding per month. On her last withdrawal, she intends to have nothing left in her bank account. How much can she withdraw at the beginning of each month?
Question 444 investment decision, corporate financial decision theory
The investment decision primarily affects which part of a business?
A firm has a debt-to-equity ratio of 25%. What is its debt-to-assets ratio?
The below three graphs show probability density functions (PDF) of three different random variables Red, Green and Blue. Let ##P_1## be the unknown price of a stock in one year. ##P_1## is a random variable. Let ##P_0 = 1##, so the share price now is $1. This one dollar is a constant, it is not a variable.
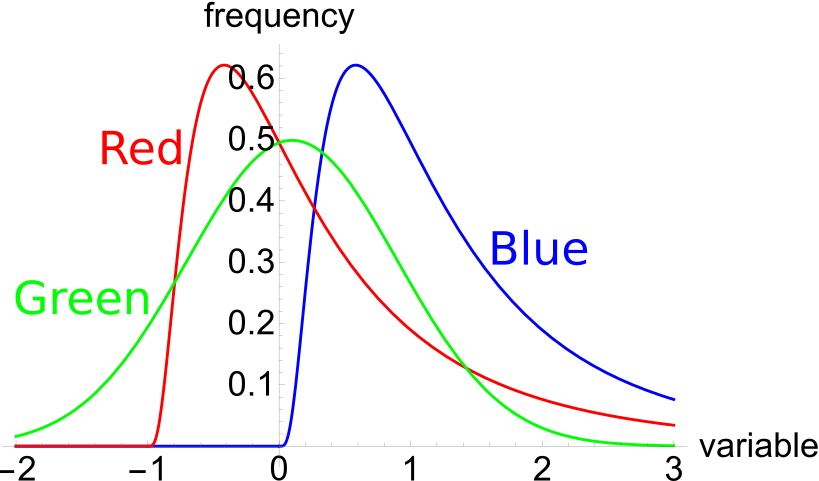
Which of the below statements is NOT correct? Financial practitioners commonly assume that the shape of the PDF represented in the colour:
A put option written on a risky non-dividend paying stock will mature in one month. As is normal, assume that the option's exercise price is non-zero and positive ##(K>0)## and the stock has limited liability ##(S>0)##.
Which of the following statements is NOT correct? The put option's:
Question 925 mean and median returns, return distribution, arithmetic and geometric averages, continuously compounding rate, no explanation
The arithmetic average and standard deviation of returns on the ASX200 accumulation index over the 24 years from 31 Dec 1992 to 31 Dec 2016 were calculated as follows:
###\bar{r}_\text{yearly} = \dfrac{ \displaystyle\sum\limits_{t=1992}^{24}{\left( \ln \left( \dfrac{P_{t+1}}{P_t} \right) \right)} }{T} = \text{AALGDR} =0.0949=9.49\% \text{ pa}###
###\sigma_\text{yearly} = \dfrac{ \displaystyle\sum\limits_{t=1992}^{24}{\left( \left( \ln \left( \dfrac{P_{t+1}}{P_t} \right) - \bar{r}_\text{yearly} \right)^2 \right)} }{T} = \text{SDLGDR} = 0.1692=16.92\text{ pp pa}###
Assume that the log gross discrete returns are normally distributed and that the above estimates are true population statistics, not sample statistics, so there is no standard error in the sample mean or standard deviation estimates. Also assume that the standardised normal Z-statistic corresponding to a one-tail probability of 2.5% is exactly -1.96.
Which of the following statements is NOT correct? If you invested $1m today in the ASX200, then over the next 4 years:
A common phrase heard in financial markets is that ‘high risk investments deserve high returns’. To make this statement consistent with the Capital Asset Pricing Model (CAPM), a high amount of what specific type of risk deserves a high return?
Investors deserve high returns when they buy assets with high:
On which date would the stock price increase if the dividend and earnings are higher than expected?
Question 979 balance of payments, current account, no explanation
This question is about the Balance of Payments.
Assume that all foreign and domestic assets are either debt which makes interest income or equity which makes dividend income, and vice versa for liabilities which cost interest and dividend payments, respectively.
Which of the following statements is NOT correct?