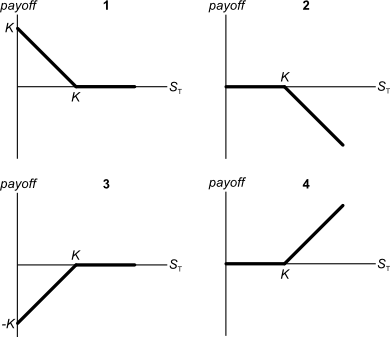
Below are 4 option graphs. Note that the y-axis is payoff at maturity (T). What options do they depict? List them in the order that they are numbered.
Question 370 capital budgeting, NPV, interest tax shield, WACC, CFFA
| Project Data | ||
| Project life | 2 yrs | |
| Initial investment in equipment | $600k | |
| Depreciation of equipment per year | $250k | |
| Expected sale price of equipment at end of project | $200k | |
| Revenue per job | $12k | |
| Variable cost per job | $4k | |
| Quantity of jobs per year | 120 | |
| Fixed costs per year, paid at the end of each year | $100k | |
| Interest expense in first year (at t=1) | $16.091k | |
| Interest expense in second year (at t=2) | $9.711k | |
| Tax rate | 30% | |
| Government treasury bond yield | 5% | |
| Bank loan debt yield | 6% | |
| Levered cost of equity | 12.5% | |
| Market portfolio return | 10% | |
| Beta of assets | 1.24 | |
| Beta of levered equity | 1.5 | |
| Firm's and project's debt-to-equity ratio | 25% | |
Notes
- The project will require an immediate purchase of $50k of inventory, which will all be sold at cost when the project ends. Current liabilities are negligible so they can be ignored.
Assumptions
- The debt-to-equity ratio will be kept constant throughout the life of the project. The amount of interest expense at the end of each period has been correctly calculated to maintain this constant debt-to-equity ratio. Note that interest expense is different in each year.
- Thousands are represented by 'k' (kilo).
- All cash flows occur at the start or end of the year as appropriate, not in the middle or throughout the year.
- All rates and cash flows are nominal. The inflation rate is 2% pa.
- All rates are given as effective annual rates.
- The 50% capital gains tax discount is not available since the project is undertaken by a firm, not an individual.
What is the net present value (NPV) of the project?
Private equity firms are known to buy medium sized private companies operating in the same industry, merge them together into a larger company, and then sell it off in a public float (initial public offering, IPO).
If medium-sized private companies trade at PE ratios of 5 and larger listed companies trade at PE ratios of 15, what return can be achieved from this strategy?
Assume that:
- The medium-sized companies can be bought, merged and sold in an IPO instantaneously.
- There are no costs of finding, valuing, merging and restructuring the medium sized companies. Also, there is no competition to buy the medium-sized companies from other private equity firms.
- The large merged firm's earnings are the sum of the medium firms' earnings.
- The only reason for the difference in medium and large firm's PE ratios is due to the illiquidity of the medium firms' shares.
- Return is defined as: ##r_{0→1} = (p_1-p_0+c_1)/p_0## , where time zero is just before the merger and time one is just after.
Question 738 financial statement, balance sheet, income statement
Where can a private firm's market value of equity be found? It can be sourced from the company's:
A share will pay its next dividend of ##C_1## in one year, and will continue to pay a dividend every year after that forever, growing at a rate of ##g##. So the next dividend will be ##C_2=C_1 (1+g)^1##, then ##C_3=C_2 (1+g)^1##, and so on forever.
The current price of the share is ##P_0## and its required return is ##r##
Which of the following is NOT equal to the expected share price in 2 years ##(P_2)## just after the dividend at that time ##(C_2)## has been paid?
Telsa Motors advertises that its Model S electric car saves $570 per month in fuel costs. Assume that Tesla cars last for 10 years, fuel and electricity costs remain the same, and savings are made at the end of each month with the first saving of $570 in one month from now.
The effective annual interest rate is 15.8%, and the effective monthly interest rate is 1.23%. What is the present value of the savings?
Question 809 Markowitz portfolio theory, CAPM, Jensens alpha, CML, systematic and idiosyncratic risk
A graph of assets’ expected returns ##(\mu)## versus standard deviations ##(\sigma)## is given in the graph below. The CML is the capital market line.
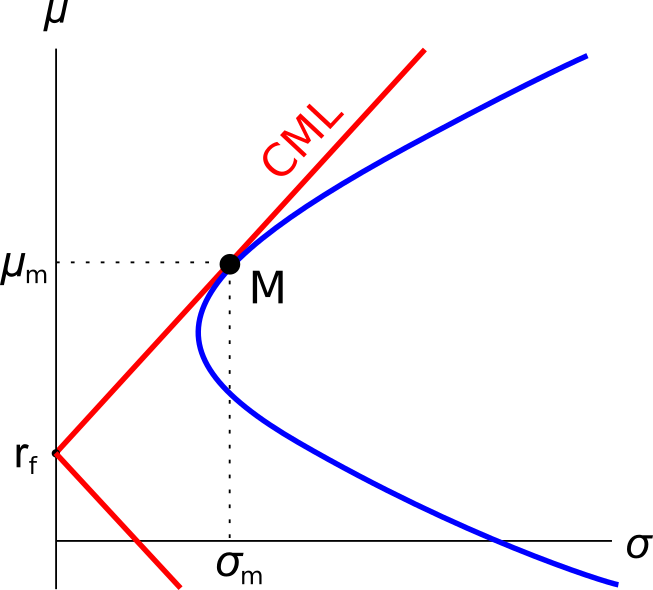
Which of the following statements about this graph, Markowitz portfolio theory and the Capital Asset Pricing Model (CAPM) theory is NOT correct?
Which form of production is included in the Gross Domestic Product (GDP) reported by the government statistics agency?
Question 872 duration, Macaulay duration, modified duration, portfolio duration
A fixed coupon bond’s modified duration is 20 years, and yields are currently 10% pa compounded annually. Which of the following statements about the bond is NOT correct?
A stock's returns are normally distributed with a mean of 10% pa and a standard deviation of 20 percentage points pa. What is the 90% confidence interval of returns over the next year? Note that the Z-statistic corresponding to a one-tail:
- 90% normal probability density function is 1.282.
- 95% normal probability density function is 1.645.
- 97.5% normal probability density function is 1.960.
The 90% confidence interval of annual returns is between: