The security market line (SML) shows the relationship between beta and expected return.
Buying investment projects that plot above the SML would lead to:
A share just paid its semi-annual dividend of $10. The dividend is expected to grow at 2% every 6 months forever. This 2% growth rate is an effective 6 month rate. Therefore the next dividend will be $10.20 in six months. The required return of the stock 10% pa, given as an effective annual rate.
What is the price of the share now?
A project has the following cash flows:
| Project Cash Flows | |
| Time (yrs) | Cash flow ($) |
| 0 | -400 |
| 1 | 0 |
| 2 | 500 |
What is the payback period of the project in years?
Normally cash flows are assumed to happen at the given time. But here, assume that the cash flows are received smoothly over the year. So the $500 at time 2 is actually earned smoothly from t=1 to t=2.
A stock is expected to pay the following dividends:
| Cash Flows of a Stock | ||||||
| Time (yrs) | 0 | 1 | 2 | 3 | 4 | ... |
| Dividend ($) | 0 | 6 | 12 | 18 | 20 | ... |
After year 4, the dividend will grow in perpetuity at 5% pa. The required return of the stock is 10% pa. Both the growth rate and required return are given as effective annual rates.
What will be the price of the stock in 7 years (t = 7), just after the dividend at that time has been paid?
Question 432 option, option intrinsic value, no explanation
An American style call option with a strike price of ##K## dollars will mature in ##T## years. The underlying asset has a price of ##S## dollars.
What is an expression for the current intrinsic value in dollars from owning (being long) the American style call option? Note that the intrinsic value of an option does not subtract the premium paid to buy the option.
Which of the following interest rate quotes is NOT equivalent to a 10% effective annual rate of return? Assume that each year has 12 months, each month has 30 days, each day has 24 hours, each hour has 60 minutes and each minute has 60 seconds. APR stands for Annualised Percentage Rate.
The below three graphs show probability density functions (PDF) of three different random variables Red, Green and Blue. Let ##P_1## be the unknown price of a stock in one year. ##P_1## is a random variable. Let ##P_0 = 1##, so the share price now is $1. This one dollar is a constant, it is not a variable.
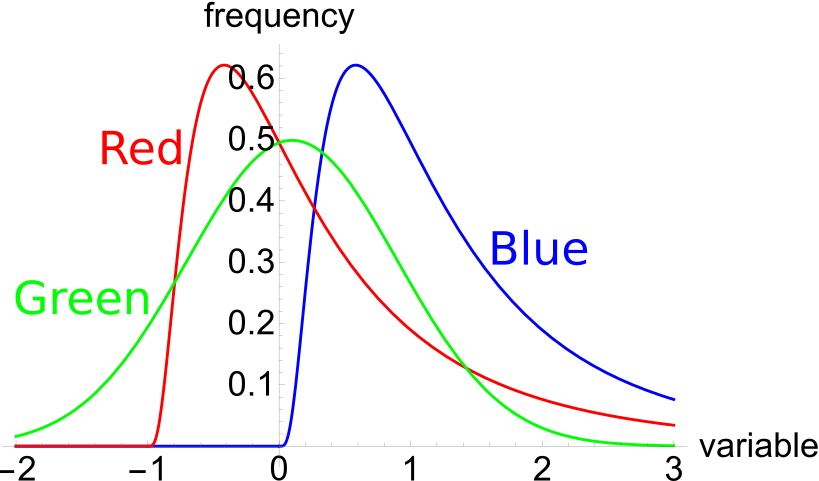
Which of the below statements is NOT correct? Financial practitioners commonly assume that the shape of the PDF represented in the colour:
Safe firms with low chances of bankruptcy will tend to have:
Below is the Australian federal government’s budget balance as a percent of GDP. Note that the columns to the right of the vertical black line were a forecast at the time. The x-axis shows financial years, so for example the 06/07 financial year represents the time period from 1 July 2006 to 30 June 2007.
Comparing the 2008/09 financial year to the previous one, the Australian federal government implemented:
Question 903 option, Black-Scholes-Merton option pricing, option on stock index
A six month European-style call option on the S&P500 stock index has a strike price of 2800 points.
The underlying S&P500 stock index currently trades at 2700 points, has a continuously compounded dividend yield of 2% pa and a standard deviation of continuously compounded returns of 25% pa.
The risk-free interest rate is 5% pa continuously compounded.
Use the Black-Scholes-Merton formula to calculate the option price. The call option price now is: