A firm can issue 5 year annual coupon bonds at a yield of 8% pa and a coupon rate of 12% pa.
The beta of its levered equity is 1. Five year government bonds yield 5% pa with a coupon rate of 6% pa. The market's expected dividend return is 4% pa and its expected capital return is 6% pa.
The firm's debt-to-equity ratio is 2:1. The corporate tax rate is 30%.
What is the firm's after-tax WACC? Assume a classical tax system.
Bonds A and B are issued by the same Australian company. Both bonds yield 7% pa, and they have the same face value ($100), maturity, seniority, and payment frequency.
The only difference is that bond A pays coupons of 10% pa and bond B pays coupons of 5% pa. Which of the following statements is true about the bonds' prices?
Question 413 CFFA, interest tax shield, depreciation tax shield
There are many ways to calculate a firm's free cash flow (FFCF), also called cash flow from assets (CFFA).
One method is to use the following formulas to transform net income (NI) into FFCF including interest and depreciation tax shields:
###FFCF=NI + Depr - CapEx -ΔNWC + IntExp###
###NI=(Rev - COGS - Depr - FC - IntExp).(1-t_c )###
Another popular method is to use EBITDA rather than net income. EBITDA is defined as:
###EBITDA=Rev - COGS - FC###
One of the below formulas correctly calculates FFCF from EBITDA, including interest and depreciation tax shields, giving an identical answer to that above. Which formula is correct?
Question 419 capital budgeting, NPV, interest tax shield, WACC, CFFA, CAPM, no explanation
| Project Data | ||
| Project life | 1 year | |
| Initial investment in equipment | $6m | |
| Depreciation of equipment per year | $6m | |
| Expected sale price of equipment at end of project | 0 | |
| Unit sales per year | 9m | |
| Sale price per unit | $8 | |
| Variable cost per unit | $6 | |
| Fixed costs per year, paid at the end of each year | $1m | |
| Interest expense in first year (at t=1) | $0.53m | |
| Tax rate | 30% | |
| Government treasury bond yield | 5% | |
| Bank loan debt yield | 6% | |
| Market portfolio return | 10% | |
| Covariance of levered equity returns with market | 0.08 | |
| Variance of market portfolio returns | 0.16 | |
| Firm's and project's debt-to-assets ratio | 50% | |
Notes
- Due to the project, current assets will increase by $5m now (t=0) and fall by $5m at the end (t=1). Current liabilities will not be affected.
Assumptions
- The debt-to-assets ratio will be kept constant throughout the life of the project. The amount of interest expense at the end of each period has been correctly calculated to maintain this constant debt-to-equity ratio.
- Millions are represented by 'm'.
- All cash flows occur at the start or end of the year as appropriate, not in the middle or throughout the year.
- All rates and cash flows are real. The inflation rate is 2% pa.
- All rates are given as effective annual rates.
- The 50% capital gains tax discount is not available since the project is undertaken by a firm, not an individual.
What is the net present value (NPV) of the project?
Acquirer firm plans to launch a takeover of Target firm. The deal is expected to create a present value of synergies totaling $0.5 million, but investment bank fees and integration costs with a present value of $1.5 million is expected. A 10% cash and 90% scrip offer will be made that pays the fair price for the target's shares only. Assume that the Target and Acquirer agree to the deal. The cash will be paid out of the firms' cash holdings, no new debt or equity will be raised.
| Firms Involved in the Takeover | ||
| Acquirer | Target | |
| Assets ($m) | 60 | 10 |
| Debt ($m) | 20 | 2 |
| Share price ($) | 10 | 8 |
| Number of shares (m) | 4 | 1 |
Assume that the firms' debt and equity are fairly priced, and that each firms' debts' risk, yield and values remain constant. The acquisition is planned to occur immediately, so ignore the time value of money.
Calculate the merged firm's share price and total number of shares after the takeover has been completed.
An investor owns a whole level of an old office building which is currently worth $1 million. There are three mutually exclusive projects that can be started by the investor. The office building level can be:
- Rented out to a tenant for one year at $0.1m paid immediately, and then sold for $0.99m in one year.
- Refurbished into more modern commercial office rooms at a cost of $1m now, and then sold for $2.4m when the refurbishment is finished in one year.
- Converted into residential apartments at a cost of $2m now, and then sold for $3.4m when the conversion is finished in one year.
All of the development projects have the same risk so the required return of each is 10% pa. The table below shows the estimated cash flows and internal rates of returns (IRR's).
| Mutually Exclusive Projects | |||
| Project | Cash flow now ($) |
Cash flow in one year ($) |
IRR (% pa) |
| Rent then sell as is | -900,000 | 990,000 | 10 |
| Refurbishment into modern offices | -2,000,000 | 2,400,000 | 20 |
| Conversion into residential apartments | -3,000,000 | 3,400,000 | 13.33 |
Which project should the investor accept?
A stock has a beta of 1.5. The market's expected total return is 10% pa and the risk free rate is 5% pa, both given as effective annual rates.
Over the last year, bad economic news was released showing a higher chance of recession. Over this time the share market fell by 1%. So ##r_{m} = (P_{0} - P_{-1})/P_{-1} = -0.01##, where the current time is zero and one year ago is time -1. The risk free rate was unchanged.
What do you think was the stock's historical return over the last year, given as an effective annual rate?
Question 809 Markowitz portfolio theory, CAPM, Jensens alpha, CML, systematic and idiosyncratic risk
A graph of assets’ expected returns ##(\mu)## versus standard deviations ##(\sigma)## is given in the graph below. The CML is the capital market line.
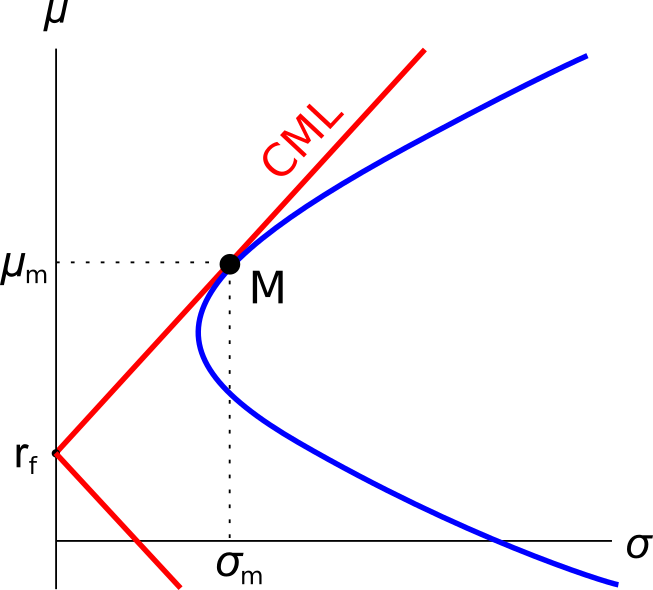
Which of the following statements about this graph, Markowitz portfolio theory and the Capital Asset Pricing Model (CAPM) theory is NOT correct?
By convention, money market securities' yields are always quoted as:
Question 948 VaR, expected shortfall
Below is a historical sample of returns on the S&P500 capital index.
| S&P500 Capital Index Daily Returns Ranked from Best to Worst |
||
| 10,000 trading days from 4th August 1977 to 24 March 2017 based on closing prices. |
||
| Rank | Date (DD-MM-YY) |
Continuously compounded daily return (% per day) |
| 1 | 21-10-87 | 9.23 |
| 2 | 08-03-83 | 8.97 |
| 3 | 13-11-08 | 8.3 |
| 4 | 30-09-08 | 8.09 |
| 5 | 28-10-08 | 8.01 |
| 6 | 29-10-87 | 7.28 |
| … | … | … |
| 9980 | 11-12-08 | -5.51 |
| 9981 | 22-10-08 | -5.51 |
| 9982 | 08-08-11 | -5.54 |
| 9983 | 22-09-08 | -5.64 |
| 9984 | 11-09-86 | -5.69 |
| 9985 | 30-11-87 | -5.88 |
| 9986 | 14-04-00 | -5.99 |
| 9987 | 07-10-98 | -6.06 |
| 9988 | 08-01-88 | -6.51 |
| 9989 | 27-10-97 | -6.55 |
| 9990 | 13-10-89 | -6.62 |
| 9991 | 15-10-08 | -6.71 |
| 9992 | 29-09-08 | -6.85 |
| 9993 | 07-10-08 | -6.91 |
| 9994 | 14-11-08 | -7.64 |
| 9995 | 01-12-08 | -7.79 |
| 9996 | 29-10-08 | -8.05 |
| 9997 | 26-10-87 | -8.4 |
| 9998 | 31-08-98 | -8.45 |
| 9999 | 09-10-08 | -12.9 |
| 10000 | 19-10-87 | -23.36 |
| Mean of all 10,000: | 0.0354 | |
| Sample standard deviation of all 10,000: | 1.2062 | |
| Sources: Bloomberg and S&P. | ||
Assume that the one-tail Z-statistic corresponding to a probability of 99.9% is exactly 3.09. Which of the following statements is NOT correct? Based on the historical data, the 99.9% daily: