A company has:
- 100 million ordinary shares outstanding which are trading at a price of $5 each. Market analysts estimated that the company's ordinary stock has a beta of 1.5. The risk-free rate is 5% and the market return is 10%.
- 1 million preferred shares which have a face (or par) value of $100 and pay a constant annual dividend of 9% of par. The next dividend will be paid in one year. Assume that all preference dividends will be paid when promised. They currently trade at a price of $90 each.
- Debentures that have a total face value of $200 million and a yield to maturity of 6% per annum. They are publicly traded and their market price is equal to 110% of their face value.
The corporate tax rate is 30%. All returns and yields are given as effective annual rates.
What is the company's after-tax Weighted Average Cost of Capital (WACC)? Assume a classical tax system.
An investor owns a whole level of an old office building which is currently worth $1 million. There are three mutually exclusive projects that can be started by the investor. The office building level can be:
- Rented out to a tenant for one year at $0.1m paid immediately, and then sold for $0.99m in one year.
- Refurbished into more modern commercial office rooms at a cost of $1m now, and then sold for $2.4m when the refurbishment is finished in one year.
- Converted into residential apartments at a cost of $2m now, and then sold for $3.4m when the conversion is finished in one year.
All of the development projects have the same risk so the required return of each is 10% pa. The table below shows the estimated cash flows and internal rates of returns (IRR's).
| Mutually Exclusive Projects | |||
| Project | Cash flow now ($) |
Cash flow in one year ($) |
IRR (% pa) |
| Rent then sell as is | -900,000 | 990,000 | 10 |
| Refurbishment into modern offices | -2,000,000 | 2,400,000 | 20 |
| Conversion into residential apartments | -3,000,000 | 3,400,000 | 13.33 |
Which project should the investor accept?
Which one of the below option and futures contracts gives the possibility of potentially unlimited gains?
Question 707 continuously compounding rate, continuously compounding rate conversion
Convert a 10% effective annual rate ##(r_\text{eff annual})## into a continuously compounded annual rate ##(r_\text{cc annual})##. The equivalent continuously compounded annual rate is:
Question 748 income and capital returns, DDM, ex dividend date
A stock will pay you a dividend of $2 tonight if you buy it today.
Thereafter the annual dividend is expected to grow by 3% pa, so the next dividend after the $2 one tonight will be $2.06 in one year, then in two years it will be $2.1218 and so on. The stock's required return is 8% pa.
What is the stock price today and what do you expect the stock price to be tomorrow, approximately?
Question 784 boot strapping zero coupon yield, forward interest rate, term structure of interest rates
Information about three risk free Government bonds is given in the table below.
| Federal Treasury Bond Data | ||||
| Maturity | Yield to maturity | Coupon rate | Face value | Price |
| (years) | (pa, compounding annually) | (pa, paid annually) | ($) | ($) |
| 1 | 0% | 2% | 100 | 102 |
| 2 | 1% | 2% | 100 | 101.9703951 |
| 3 | 2% | 2% | 100 | 100 |
Based on the above government bonds' yields to maturity, which of the below statements about the spot zero rates and forward zero rates is NOT correct?
Question 834 option, delta, theta, gamma, standard deviation, Black-Scholes-Merton option pricing
Which of the following statements about an option (either a call or put) and its underlying stock is NOT correct?
| European Call Option | ||
| on a non-dividend paying stock | ||
| Description | Symbol | Quantity |
| Spot price ($) | ##S_0## | 20 |
| Strike price ($) | ##K_T## | 18 |
| Risk free cont. comp. rate (pa) | ##r## | 0.05 |
| Standard deviation of the stock's cont. comp. returns (pa) | ##\sigma## | 0.3 |
| Option maturity (years) | ##T## | 1 |
| Call option price ($) | ##c_0## | 3.939488 |
| Delta | ##\Delta = N[d_1]## | 0.747891 |
| ##N[d_2]## | ##N[d_2]## | 0.643514 |
| Gamma | ##\Gamma## | 0.053199 |
| Theta ($/year) | ##\Theta = \partial c / \partial T## | 1.566433 |
Calculate Australia’s GDP over the 2016 calendar year using the below table:
| Australian Gross Domestic Product Components | ||||
| A$ billion, 2016 Calendar Year from 1 Jan 2016 to 31 Dec 2016 inclusive | ||||
| Consumption | Investment | Government spending | Exports | Imports |
| 971 | 421 | 320 | 328 | 344 |
Source: ABS 5206.0 Australian National Accounts: National Income, Expenditure and Product. Table 3. Expenditure on Gross Domestic Product (GDP), Current prices.
Over the 2016 calendar year, Australia’s GDP was:
Question 897 comparative advantage in trade, production possibilities curve, no explanation
Adam and Bella are the only people on a remote island. Their production possibility curves are shown in the graph.
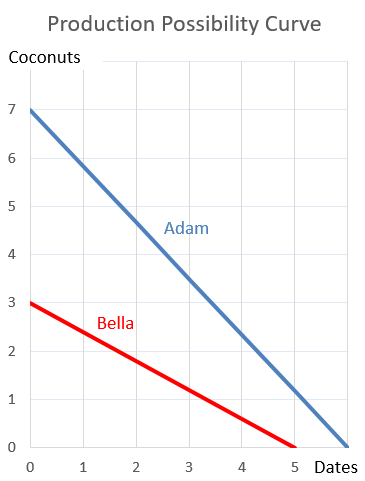
Which of the following statements is NOT correct?