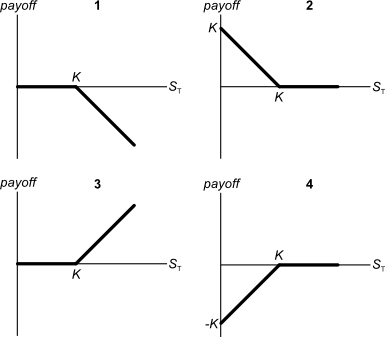
Below are 4 option graphs. Note that the y-axis is payoff at maturity (T). What options do they depict? List them in the order that they are numbered
A project's NPV is positive. Select the most correct statement:
You have $100,000 in the bank. The bank pays interest at 10% pa, given as an effective annual rate.
You wish to consume an equal amount now (t=0), in one year (t=1) and in two years (t=2), and still have $50,000 in the bank after that (t=2).
How much can you consume at each time?
Question 579 price gains and returns over time, time calculation, effective rate
How many years will it take for an asset's price to double if the price grows by 10% pa?
Question 796 option, Black-Scholes-Merton option pricing, option delta, no explanation
Which of the following quantities from the Black-Scholes-Merton option pricing formula gives the risk-neutral probability that a European call option will be exercised?
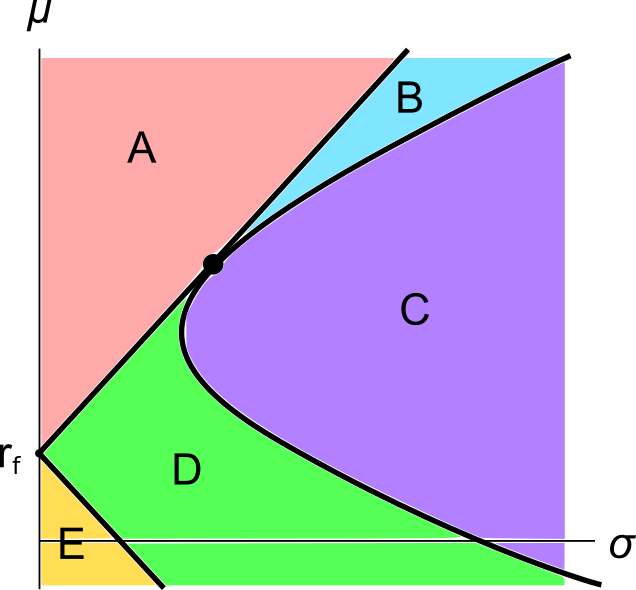
A graph of assets’ expected returns ##(\mu)## versus standard deviations ##(\sigma)## is given in the below diagram.
Each letter corresponds to a separate coloured area. The portfolios at the boundary of the areas, on the black lines, are excluded from each area. Assume that all assets represented in this graph are fairly priced, and that all risky assets can be short-sold.
Which of the following statements about this graph and Markowitz portfolio theory is NOT correct?
Question 869 economic order quantity
A Queensland farmer grows strawberries in greenhouses and supplies Australian supermarkets all year round. The farmer must decide how often he should contract the truck driver to deliver his strawberries and how many boxes to send on each delivery. The farmer:
- Sells 100,000 boxes of strawberries per year;
- Incurs holding costs (refrigeration and spoilage) of $16 per box per year; and
- Must pay the truck driver delivery fees at $0.20 per box plus a $500 fixed fee per delivery.
Which of the following statements about the Economic Order Quantity is NOT correct?
Question 920 SML, CAPM, Sharpe ratio, Treynor ratio, Jensens alpha, no explanation
Over-priced assets should NOT:
A stock's returns are normally distributed with a mean of 10% pa and a standard deviation of 20 percentage points pa. What is the 95% confidence interval of returns over the next year? Note that the Z-statistic corresponding to a one-tail:
- 90% normal probability density function is 1.282.
- 95% normal probability density function is 1.645.
- 97.5% normal probability density function is 1.960.
The 95% confidence interval of annual returns is between: