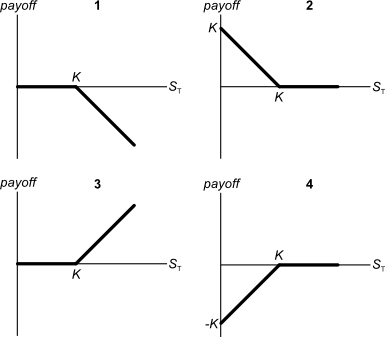
Below are 4 option graphs. Note that the y-axis is payoff at maturity (T). What options do they depict? List them in the order that they are numbered
A stock is expected to pay a dividend of $15 in one year (t=1), then $25 for 9 years after that (payments at t=2 ,3,...10), and on the 11th year (t=11) the dividend will be 2% less than at t=10, and will continue to shrink at the same rate every year after that forever. The required return of the stock is 10%. All rates are effective annual rates.
What is the price of the stock now?
Which business structure or structures have the advantage of limited liability for equity investors?
A share currently worth $100 is expected to pay a constant dividend of $4 for the next 5 years with the first dividend in one year (t=1) and the last in 5 years (t=5).
The total required return is 10% pa.
What do you expected the share price to be in 5 years, just after the dividend at that time has been paid?
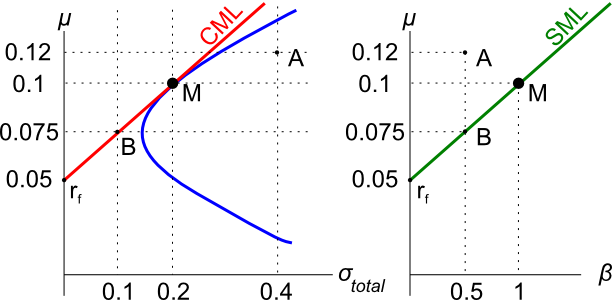
Assets A, B, M and ##r_f## are shown on the graphs above. Asset M is the market portfolio and ##r_f## is the risk free yield on government bonds. Which of the below statements is NOT correct?
Question 657 systematic and idiosyncratic risk, CAPM, no explanation
A stock's required total return will decrease when its:
A trader sells one crude oil European style put option contract on the CME expiring in one year with an exercise price of $44 per barrel for a price of $6.64. The crude oil spot price is $40.33. If the trader doesn’t close out her contract before maturity, then at maturity she will have the:
Question 905 market capitalisation of equity, PE ratio, payout ratio
The below graph shows the computer software company Microsoft's stock price (MSFT) at the market close on the NASDAQ on Friday 1 June 2018.
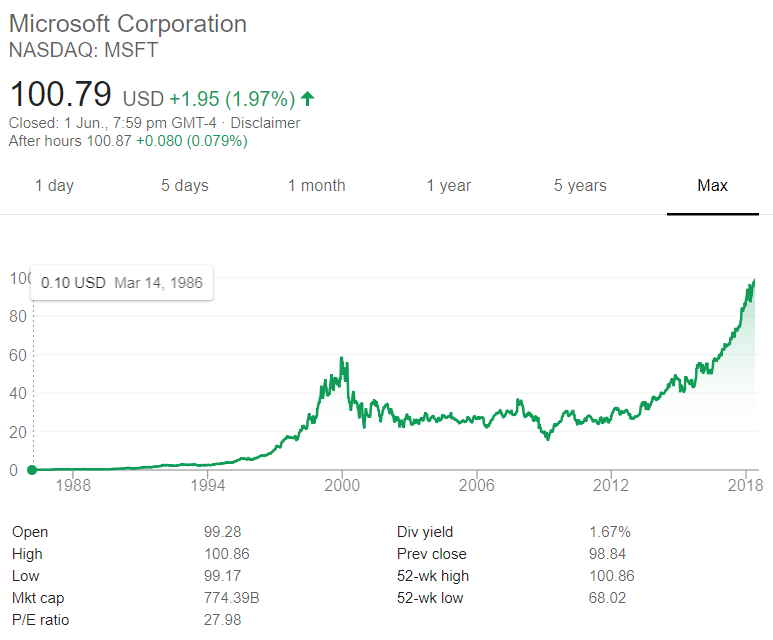
Based on the screenshot above, which of the following statements about MSFT is NOT correct? MSFT's: