For a price of $100, Rad will sell you a 5 year bond paying semi-annual coupons of 16% pa. The face value of the bond is $100. Other bonds with the same risk, maturity and coupon characteristics trade at a yield of 6% pa.
The required return of a project is 10%, given as an effective annual rate. Assume that the cash flows shown in the table are paid all at once at the given point in time.
What is the Profitability Index (PI) of the project?
| Project Cash Flows | |
| Time (yrs) | Cash flow ($) |
| 0 | -100 |
| 1 | 0 |
| 2 | 121 |
Which of the following investable assets are NOT suitable for valuation using PE multiples techniques?
The below screenshot of Commonwealth Bank of Australia's (CBA) details were taken from the Google Finance website on 7 Nov 2014. Some information has been deliberately blanked out.
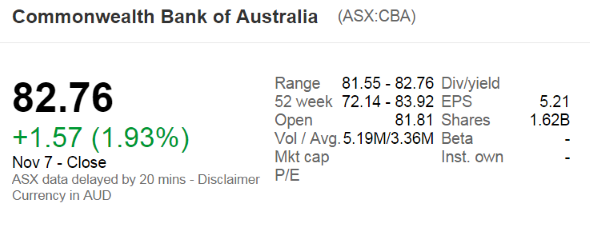
What was CBA's backwards-looking price-earnings ratio?
An investor bought a 20 year 5% pa fixed coupon government bond priced at par. The face value is $100. Coupons are paid semi-annually and the next one is in 6 months.
Six months later, just after the coupon at that time was paid, yields suddenly and unexpectedly rose to 5.5% pa. Note that all yields above are given as APR's compounding semi-annually.
What was the bond investors' historical total return over that first 6 month period, given as an effective semi-annual rate?
A share will pay its next dividend of ##C_1## in one year, and will continue to pay a dividend every year after that forever, growing at a rate of ##g##. So the next dividend will be ##C_2=C_1 (1+g)^1##, then ##C_3=C_2 (1+g)^1##, and so on forever.
The current price of the share is ##P_0## and its required return is ##r##
Which of the following is NOT equal to the expected share price in 2 years ##(P_2)## just after the dividend at that time ##(C_2)## has been paid?
What derivative position are you exposed to if you have the obligation to sell the underlying asset at maturity, so you will definitely be forced to sell the underlying asset?
Question 850 gross domestic product, gross domestic product per capita
Below is a table showing some countries’ GDP, population and GDP per capita.
| Countries' GDP and Population | |||
| GDP | Population | GDP per capita | |
| USD million | millions of people | USD | |
| United States | 18,036,648 | 325 | 55,492 |
| China | 11,158,457 | 1,383 | 8,066 |
| Japan | 4,383,076 | 127 | 34,586 |
| Germany | 3,363,600 | 83 | 40,623 |
| Norway | 500,519 | 5 | 95,027 |
Source: "GDP and its breakdown at current prices in US Dollars" United Nations Statistics Division. December 2016.
Using this data only, which one of these countries’ citizens have the highest living standards?
A bank bill was bought for $99,000 and sold for $100,000 thirty (30) days later. There are 365 days in the year. Which of the following formulas gives the simple interest rate per annum over those 30 days?
Note: To help you identify which is the correct answer without doing any calculations yourself, the formulas used to calculate the numbers are given.