For a price of $100, Rad will sell you a 5 year bond paying semi-annual coupons of 16% pa. The face value of the bond is $100. Other bonds with the same risk, maturity and coupon characteristics trade at a yield of 6% pa.
The required return of a project is 10%, given as an effective annual rate. Assume that the cash flows shown in the table are paid all at once at the given point in time.
What is the Profitability Index (PI) of the project?
| Project Cash Flows | |
| Time (yrs) | Cash flow ($) |
| 0 | -100 |
| 1 | 0 |
| 2 | 121 |
A firm's weighted average cost of capital before tax (##r_\text{WACC before tax}##) would increase due to:
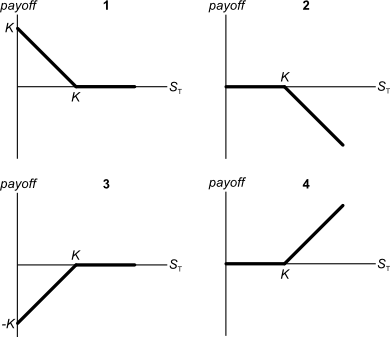
Below are 4 option graphs. Note that the y-axis is payoff at maturity (T). What options do they depict? List them in the order that they are numbered.
Find the sample standard deviation of returns using the data in the table:
| Stock Returns | |
| Year | Return pa |
| 2008 | 0.3 |
| 2009 | 0.02 |
| 2010 | -0.2 |
| 2011 | 0.4 |
The returns above and standard deviations below are given in decimal form.
A new company's Firm Free Cash Flow (FFCF, same as CFFA) is forecast in the graph below.
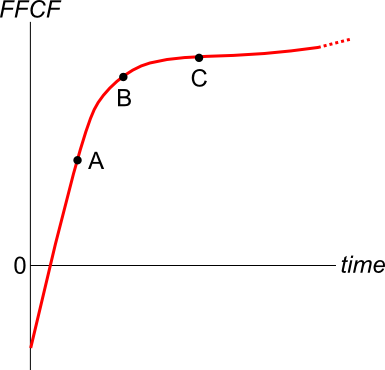
To value the firm's assets, the terminal value needs to be calculated using the perpetuity with growth formula:
###V_{\text{terminal, }t-1} = \dfrac{FFCF_{\text{terminal, }t}}{r-g}###
Which point corresponds to the best time to calculate the terminal value?
One of the reasons why firms may not begin projects with relatively small positive net present values (NPV's) is because they wish to maximise the value of their:
A trader sells one crude oil European style call option contract on the CME expiring in one year with an exercise price of $44 per barrel for a price of $6.64. The crude oil spot price is $40.33. If the trader doesn’t close out her contract before maturity, then at maturity she will have the:
Examine the graph of the AUD versus the USD, EUR and JPY. Note that RHS means right hand side and LHS left hand side which indicates which axis each line corresponds to. Assume inflation rates in each country were equal over the time period 1984 to 2018.
Which of the following statements is NOT correct?
Question 895 comparative advantage in trade, production possibilities curve
Adam and Bella are the only people on a remote island.
Luckily there are Coconut and Date palm trees on the island that grow delicious fruit. The problem is that harvesting the fruit takes a lot of work.
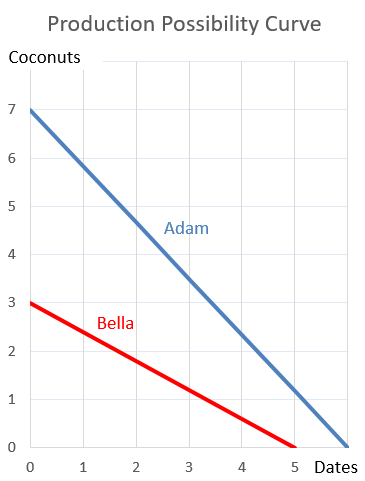
Adam can pick 7 coconuts per hour, 6 dates per hour or any linear combination of coconuts and dates. For example, he could pick 3.5 coconuts and 3 dates per hour.
Bella can pick 3 coconuts per hour, 5 dates per hour or any linear combination. For example, she could pick 1.5 coconuts and 2.5 dates per hour.
This information is summarised in the table and graph:
| Harvest Rates Per Hour | ||
| Coconuts | Dates | |
| Adam | 7 | 6 |
| Bella | 3 | 5 |
Which of the following statements is NOT correct?