A bond maturing in 10 years has a coupon rate of 4% pa, paid semi-annually. The bond's yield is currently 6% pa. The face value of the bond is $100. What is its price?
A stock is expected to pay the following dividends:
| Cash Flows of a Stock | ||||||
| Time (yrs) | 0 | 1 | 2 | 3 | 4 | ... |
| Dividend ($) | 0 | 6 | 12 | 18 | 20 | ... |
After year 4, the dividend will grow in perpetuity at 5% pa. The required return of the stock is 10% pa. Both the growth rate and required return are given as effective annual rates.
What is the current price of the stock?
Which of the following investable assets are NOT suitable for valuation using PE multiples techniques?
One formula for calculating a levered firm's free cash flow (FFCF, or CFFA) is to use net operating profit after tax (NOPAT).
###\begin{aligned} FFCF &= NOPAT + Depr - CapEx -\Delta NWC \\ &= (Rev - COGS - Depr - FC)(1-t_c) + Depr - CapEx -\Delta NWC \\ \end{aligned} \\###
The below graph shows a project's net present value (NPV) against its annual discount rate.
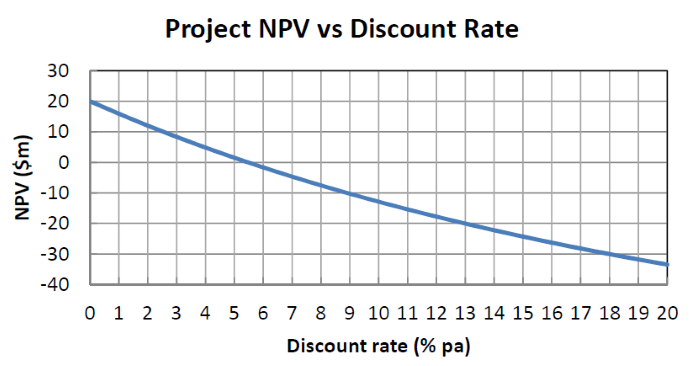
Which of the following statements is NOT correct?
Which of the following statements about option contracts is NOT correct? For every:
The 'time value of money' is most closely related to which of the following concepts?
A share’s current price is $60. It’s expected to pay a dividend of $1.50 in one year. The growth rate of the dividend is 0.5% pa and the stock’s required total return is 3% pa. The stock’s price can be modeled using the dividend discount model (DDM):
##P_0=\dfrac{C_1}{r-g}##
Which of the following methods is NOT equal to the stock’s expected price in one year and six months (t=1.5 years)? Note that the symbolic formulas shown in each line below do equal the formulas with numbers. The formula is just repeated with symbols and then numbers in case it helps you to identify the incorrect statement more quickly.
Question 850 gross domestic product, gross domestic product per capita
Below is a table showing some countries’ GDP, population and GDP per capita.
| Countries' GDP and Population | |||
| GDP | Population | GDP per capita | |
| USD million | millions of people | USD | |
| United States | 18,036,648 | 325 | 55,492 |
| China | 11,158,457 | 1,383 | 8,066 |
| Japan | 4,383,076 | 127 | 34,586 |
| Germany | 3,363,600 | 83 | 40,623 |
| Norway | 500,519 | 5 | 95,027 |
Source: "GDP and its breakdown at current prices in US Dollars" United Nations Statistics Division. December 2016.
Using this data only, which one of these countries’ citizens have the highest living standards?