A project has an internal rate of return (IRR) which is greater than its required return. Select the most correct statement.
Question 213 income and capital returns, bond pricing, premium par and discount bonds
The coupon rate of a fixed annual-coupon bond is constant (always the same).
What can you say about the income return (##r_\text{income}##) of a fixed annual coupon bond? Remember that:
###r_\text{total} = r_\text{income} + r_\text{capital}###
###r_\text{total, 0 to 1} = \frac{c_1}{p_0} + \frac{p_1-p_0}{p_0}###
Assume that there is no change in the bond's total annual yield to maturity from when it is issued to when it matures.
Select the most correct statement.
From its date of issue until maturity, the income return of a fixed annual coupon:
Question 245 foreign exchange rate, monetary policy, foreign exchange rate direct quote, no explanation
Investors expect Australia's central bank, the RBA, to leave the policy rate unchanged at their next meeting.
Then unexpectedly, the policy rate is reduced due to fears that Australia's GDP growth is slowing.
What do you expect to happen to Australia's exchange rate? Direct and indirect quotes are given from the perspective of an Australian.
The Australian dollar will:
A 90-day $1 million Bank Accepted Bill (BAB) was bought for $990,000 and sold 30 days later for $996,000 (at t=30 days).
What was the total return, capital return and income return over the 30 days it was held?
Despite the fact that money market instruments such as bills are normally quoted with simple interest rates, please calculate your answers as compound interest rates, specifically, as effective 30-day rates, which is how the below answer choices are listed.
##r_\text{total}##, ##r_\text{capital}##, ## r_\text{income}##
A new company's Firm Free Cash Flow (FFCF, same as CFFA) is forecast in the graph below.
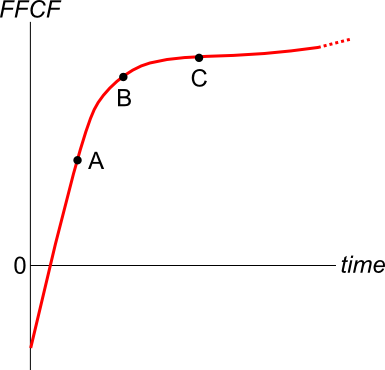
To value the firm's assets, the terminal value needs to be calculated using the perpetuity with growth formula:
###V_{\text{terminal, }t-1} = \dfrac{FFCF_{\text{terminal, }t}}{r-g}###
Which point corresponds to the best time to calculate the terminal value?
An investor owns an empty block of land that has local government approval to be developed into a petrol station, car wash or car park. The council will only allow a single development so the projects are mutually exclusive.
All of the development projects have the same risk and the required return of each is 10% pa. Each project has an immediate cost and once construction is finished in one year the land and development will be sold. The table below shows the estimated costs payable now, expected sale prices in one year and the internal rates of returns (IRR's).
| Mutually Exclusive Projects | |||
| Project | Cost now ($) |
Sale price in one year ($) |
IRR (% pa) |
| Petrol station | 9,000,000 | 11,000,000 | 22.22 |
| Car wash | 800,000 | 1,100,000 | 37.50 |
| Car park | 70,000 | 110,000 | 57.14 |
Which project should the investor accept?
Question 579 price gains and returns over time, time calculation, effective rate
How many years will it take for an asset's price to double if the price grows by 10% pa?
Which of the following statements about yield curves is NOT correct?
Below is a graph of the USD against the JPY and EUR from 1980 to 2015, compiled by the RBA. Select the correct statement about what occurred between 1980 and 2015. Note that in 1980 the euro was around 1.3 USD per EUR and the Yen was around 250 JPY per USD.