For a price of $95, Nicole will sell you a 10 year bond paying semi-annual coupons of 8% pa. The face value of the bond is $100. Other bonds with the same risk, maturity and coupon characteristics trade at a yield of 8% pa.
The total return of any asset can be broken down in different ways. One possible way is to use the dividend discount model (or Gordon growth model):
###p_0 = \frac{c_1}{r_\text{total}-r_\text{capital}}###
Which, since ##c_1/p_0## is the income return (##r_\text{income}##), can be expressed as:
###r_\text{total}=r_\text{income}+r_\text{capital}###
So the total return of an asset is the income component plus the capital or price growth component.
Another way to break up total return is to use the Capital Asset Pricing Model:
###r_\text{total}=r_\text{f}+β(r_\text{m}- r_\text{f})###
###r_\text{total}=r_\text{time value}+r_\text{risk premium}###
So the risk free rate is the time value of money and the term ##β(r_\text{m}- r_\text{f})## is the compensation for taking on systematic risk.
Using the above theory and your general knowledge, which of the below equations, if any, are correct?
(I) ##r_\text{income}=r_\text{time value}##
(II) ##r_\text{income}=r_\text{risk premium}##
(III) ##r_\text{capital}=r_\text{time value}##
(IV) ##r_\text{capital}=r_\text{risk premium}##
(V) ##r_\text{income}+r_\text{capital}=r_\text{time value}+r_\text{risk premium}##
Which of the equations are correct?
There are many ways to write the ordinary annuity formula.
Which of the following is NOT equal to the ordinary annuity formula?
Question 338 market efficiency, CAPM, opportunity cost, technical analysis
A man inherits $500,000 worth of shares.
He believes that by learning the secrets of trading, keeping up with the financial news and doing complex trend analysis with charts that he can quit his job and become a self-employed day trader in the equities markets.
What is the expected gain from doing this over the first year? Measure the net gain in wealth received at the end of this first year due to the decision to become a day trader. Assume the following:
- He earns $60,000 pa in his current job, paid in a lump sum at the end of each year.
- He enjoys examining share price graphs and day trading just as much as he enjoys his current job.
- Stock markets are weak form and semi-strong form efficient.
- He has no inside information.
- He makes 1 trade every day and there are 250 trading days in the year. Trading costs are $20 per trade. His broker invoices him for the trading costs at the end of the year.
- The shares that he currently owns and the shares that he intends to trade have the same level of systematic risk as the market portfolio.
- The market portfolio's expected return is 10% pa.
Measure the net gain over the first year as an expected wealth increase at the end of the year.
Question 370 capital budgeting, NPV, interest tax shield, WACC, CFFA
| Project Data | ||
| Project life | 2 yrs | |
| Initial investment in equipment | $600k | |
| Depreciation of equipment per year | $250k | |
| Expected sale price of equipment at end of project | $200k | |
| Revenue per job | $12k | |
| Variable cost per job | $4k | |
| Quantity of jobs per year | 120 | |
| Fixed costs per year, paid at the end of each year | $100k | |
| Interest expense in first year (at t=1) | $16.091k | |
| Interest expense in second year (at t=2) | $9.711k | |
| Tax rate | 30% | |
| Government treasury bond yield | 5% | |
| Bank loan debt yield | 6% | |
| Levered cost of equity | 12.5% | |
| Market portfolio return | 10% | |
| Beta of assets | 1.24 | |
| Beta of levered equity | 1.5 | |
| Firm's and project's debt-to-equity ratio | 25% | |
Notes
- The project will require an immediate purchase of $50k of inventory, which will all be sold at cost when the project ends. Current liabilities are negligible so they can be ignored.
Assumptions
- The debt-to-equity ratio will be kept constant throughout the life of the project. The amount of interest expense at the end of each period has been correctly calculated to maintain this constant debt-to-equity ratio. Note that interest expense is different in each year.
- Thousands are represented by 'k' (kilo).
- All cash flows occur at the start or end of the year as appropriate, not in the middle or throughout the year.
- All rates and cash flows are nominal. The inflation rate is 2% pa.
- All rates are given as effective annual rates.
- The 50% capital gains tax discount is not available since the project is undertaken by a firm, not an individual.
What is the net present value (NPV) of the project?
Question 418 capital budgeting, NPV, interest tax shield, WACC, CFFA, CAPM
| Project Data | ||
| Project life | 1 year | |
| Initial investment in equipment | $8m | |
| Depreciation of equipment per year | $8m | |
| Expected sale price of equipment at end of project | 0 | |
| Unit sales per year | 4m | |
| Sale price per unit | $10 | |
| Variable cost per unit | $5 | |
| Fixed costs per year, paid at the end of each year | $2m | |
| Interest expense in first year (at t=1) | $0.562m | |
| Corporate tax rate | 30% | |
| Government treasury bond yield | 5% | |
| Bank loan debt yield | 9% | |
| Market portfolio return | 10% | |
| Covariance of levered equity returns with market | 0.32 | |
| Variance of market portfolio returns | 0.16 | |
| Firm's and project's debt-to-equity ratio | 50% | |
Notes
- Due to the project, current assets will increase by $6m now (t=0) and fall by $6m at the end (t=1). Current liabilities will not be affected.
Assumptions
- The debt-to-equity ratio will be kept constant throughout the life of the project. The amount of interest expense at the end of each period has been correctly calculated to maintain this constant debt-to-equity ratio.
- Millions are represented by 'm'.
- All cash flows occur at the start or end of the year as appropriate, not in the middle or throughout the year.
- All rates and cash flows are real. The inflation rate is 2% pa. All rates are given as effective annual rates.
- The project is undertaken by a firm, not an individual.
What is the net present value (NPV) of the project?
Question 455 income and capital returns, payout policy, DDM, market efficiency
A fairly priced unlevered firm plans to pay a dividend of $1 next year (t=1) which is expected to grow by 3% pa every year after that. The firm's required return on equity is 8% pa.
The firm is thinking about reducing its future dividend payments by 10% so that it can use the extra cash to invest in more projects which are expected to return 8% pa, and have the same risk as the existing projects. Therefore, next year's dividend will be $0.90. No new equity or debt will be issued to fund the new projects, they'll all be funded by the cut in dividends.
What will be the stock's new annual capital return (proportional increase in price per year) if the change in payout policy goes ahead?
Assume that payout policy is irrelevant to firm value (so there's no signalling effects) and that all rates are effective annual rates.
A firm is considering a business project which costs $11m now and is expected to pay a constant $1m at the end of every year forever.
Assume that the initial $11m cost is funded using the firm's existing cash so no new equity or debt will be raised. The cost of capital is 10% pa.
Which of the following statements about net present value (NPV), internal rate of return (IRR) and payback period is NOT correct?
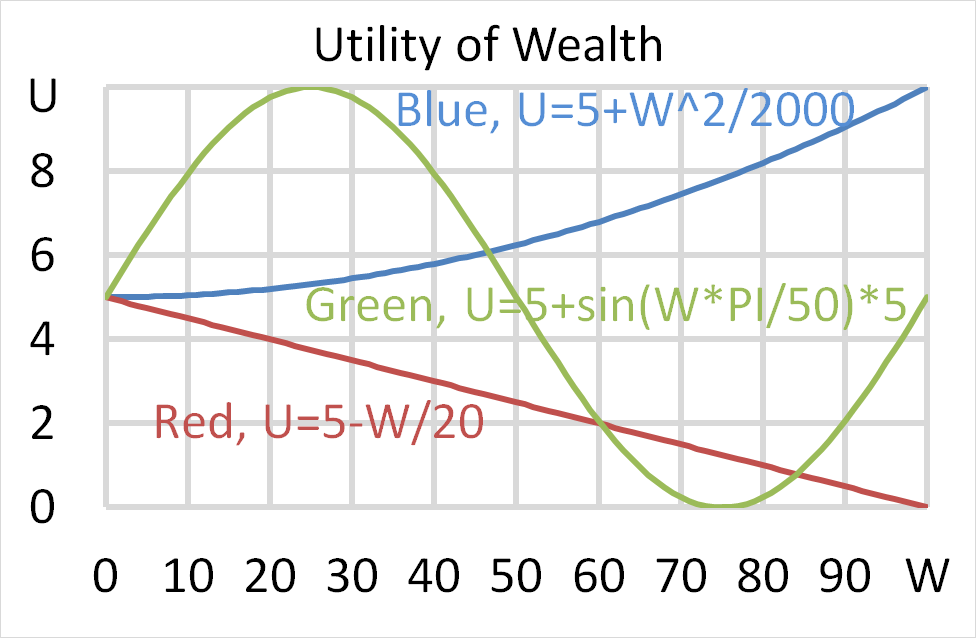
Question 702 utility, risk aversion, utility function, gamble
Mr Blue, Miss Red and Mrs Green are people with different utility functions.
Each person has $50 of initial wealth. A coin toss game is offered to each person at a casino where the player can win or lose $50. Each player can flip a coin and if they flip heads, they receive $50. If they flip tails then they will lose $50. Which of the following statements is NOT correct?
Below is the Australian federal government’s budget balance as a percent of GDP. Note that the columns to the right of the vertical black line were a forecast at the time. The x-axis shows financial years, so for example the 06/07 financial year represents the time period from 1 July 2006 to 30 June 2007.
Comparing the 2008/09 financial year to the previous one, the Australian federal government implemented: