For a price of $95, Nicole will sell you a 10 year bond paying semi-annual coupons of 8% pa. The face value of the bond is $100. Other bonds with the same risk, maturity and coupon characteristics trade at a yield of 8% pa.
When using the dividend discount model, care must be taken to avoid using a nominal dividend growth rate that exceeds the country's nominal GDP growth rate. Otherwise the firm is forecast to take over the country since it grows faster than the average business forever.
Suppose a firm's nominal dividend grows at 10% pa forever, and nominal GDP growth is 5% pa forever. The firm's total dividends are currently $1 billion (t=0). The country's GDP is currently $1,000 billion (t=0).
In approximately how many years will the company's total dividends be as large as the country's GDP?
Question 339 bond pricing, inflation, market efficiency, income and capital returns
Economic statistics released this morning were a surprise: they show a strong chance of consumer price inflation (CPI) reaching 5% pa over the next 2 years.
This is much higher than the previous forecast of 3% pa.
A vanilla fixed-coupon 2-year risk-free government bond was issued at par this morning, just before the economic news was released.
What is the expected change in bond price after the economic news this morning, and in the next 2 years? Assume that:
- Inflation remains at 5% over the next 2 years.
- Investors demand a constant real bond yield.
- The bond price falls by the (after-tax) value of the coupon the night before the ex-coupon date, as in real life.
Question 385 Merton model of corporate debt, real option, option
A risky firm will last for one period only (t=0 to 1), then it will be liquidated. So it's assets will be sold and the debt holders and equity holders will be paid out in that order. The firm has the following quantities:
##V## = Market value of assets.
##E## = Market value of (levered) equity.
##D## = Market value of zero coupon bonds.
##F_1## = Total face value of zero coupon bonds which is promised to be paid in one year.
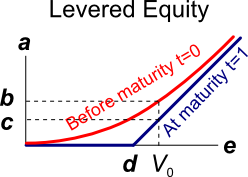
The levered equity graph above contains bold labels a to e. Which of the following statements about those labels is NOT correct?
Question 398 financial distress, capital raising, leverage, capital structure, NPV
A levered firm has zero-coupon bonds which mature in one year and have a combined face value of $9.9m.
Investors are risk-neutral and therefore all debt and equity holders demand the same required return of 10% pa.
In one year the firm's assets will be worth:
- $13.2m with probability 0.5 in the good state of the world, or
- $6.6m with probability 0.5 in the bad state of the world.
A new project presents itself which requires an investment of $2m and will provide a certain cash flow of $3.3m in one year.
The firm doesn't have any excess cash to make the initial $2m investment, but the funds can be raised from shareholders through a fairly priced rights issue. Ignore all transaction costs.
Should shareholders vote to proceed with the project and equity raising? What will be the gain in shareholder wealth if they decide to proceed?
Read the following financial statements and calculate the firm's free cash flow over the 2014 financial year.
| UBar Corp | ||
| Income Statement for | ||
| year ending 30th June 2014 | ||
| $m | ||
| Sales | 293 | |
| COGS | 200 | |
| Rent expense | 15 | |
| Gas expense | 8 | |
| Depreciation | 10 | |
| EBIT | 60 | |
| Interest expense | 0 | |
| Taxable income | 60 | |
| Taxes | 18 | |
| Net income | 42 | |
| UBar Corp | ||
| Balance Sheet | ||
| as at 30th June | 2014 | 2013 |
| $m | $m | |
| Assets | ||
| Cash | 30 | 29 |
| Accounts receivable | 5 | 7 |
| Pre-paid rent expense | 1 | 0 |
| Inventory | 50 | 46 |
| PPE | 290 | 300 |
| Total assets | 376 | 382 |
| Liabilities | ||
| Trade payables | 20 | 18 |
| Accrued gas expense | 3 | 2 |
| Non-current liabilities | 0 | 0 |
| Contributed equity | 212 | 212 |
| Retained profits | 136 | 150 |
| Asset revaluation reserve | 5 | 0 |
| Total L and OE | 376 | 382 |
Note: all figures are given in millions of dollars ($m).
The firm's free cash flow over the 2014 financial year was:
Question 548 equivalent annual cash flow, time calculation, no explanation
An Apple iPhone 6 smart phone can be bought now for $999. An Android Kogan Agora 4G+ smart phone can be bought now for $240.
If the Kogan phone lasts for one year, approximately how long must the Apple phone last for to have the same equivalent annual cost?
Assume that both phones have equivalent features besides their lifetimes, that both are worthless once they've outlasted their life, the discount rate is 10% pa given as an effective annual rate, and there are no extra costs or benefits from either phone.
An equity index is currently at 4,800 points. The 1.5 year futures price is 5,100 points and the total required return is 6% pa with continuous compounding. Each index point is worth $25.
What is the implied dividend yield as a continuously compounded rate per annum?
A stock's total standard deviation of returns is 20% pa. The market portfolio's total standard deviation of returns is 15% pa. The beta of the stock is 0.8.
What is the stock's diversifiable standard deviation?
Question 948 VaR, expected shortfall
Below is a historical sample of returns on the S&P500 capital index.
| S&P500 Capital Index Daily Returns Ranked from Best to Worst |
||
| 10,000 trading days from 4th August 1977 to 24 March 2017 based on closing prices. |
||
| Rank | Date (DD-MM-YY) |
Continuously compounded daily return (% per day) |
| 1 | 21-10-87 | 9.23 |
| 2 | 08-03-83 | 8.97 |
| 3 | 13-11-08 | 8.3 |
| 4 | 30-09-08 | 8.09 |
| 5 | 28-10-08 | 8.01 |
| 6 | 29-10-87 | 7.28 |
| … | … | … |
| 9980 | 11-12-08 | -5.51 |
| 9981 | 22-10-08 | -5.51 |
| 9982 | 08-08-11 | -5.54 |
| 9983 | 22-09-08 | -5.64 |
| 9984 | 11-09-86 | -5.69 |
| 9985 | 30-11-87 | -5.88 |
| 9986 | 14-04-00 | -5.99 |
| 9987 | 07-10-98 | -6.06 |
| 9988 | 08-01-88 | -6.51 |
| 9989 | 27-10-97 | -6.55 |
| 9990 | 13-10-89 | -6.62 |
| 9991 | 15-10-08 | -6.71 |
| 9992 | 29-09-08 | -6.85 |
| 9993 | 07-10-08 | -6.91 |
| 9994 | 14-11-08 | -7.64 |
| 9995 | 01-12-08 | -7.79 |
| 9996 | 29-10-08 | -8.05 |
| 9997 | 26-10-87 | -8.4 |
| 9998 | 31-08-98 | -8.45 |
| 9999 | 09-10-08 | -12.9 |
| 10000 | 19-10-87 | -23.36 |
| Mean of all 10,000: | 0.0354 | |
| Sample standard deviation of all 10,000: | 1.2062 | |
| Sources: Bloomberg and S&P. | ||
Assume that the one-tail Z-statistic corresponding to a probability of 99.9% is exactly 3.09. Which of the following statements is NOT correct? Based on the historical data, the 99.9% daily: