A share just paid its semi-annual dividend of $10. The dividend is expected to grow at 2% every 6 months forever. This 2% growth rate is an effective 6 month rate. Therefore the next dividend will be $10.20 in six months. The required return of the stock is 10% pa, given as an effective annual rate.
What is the price of the share now?
You want to buy an apartment priced at $500,000. You have saved a deposit of $50,000. The bank has agreed to lend you the $450,000 as an interest only loan with a term of 30 years. The interest rate is 6% pa and is not expected to change. What will be your monthly payments?
Question 180 equivalent annual cash flow, inflation, real and nominal returns and cash flows
Details of two different types of light bulbs are given below:
- Low-energy light bulbs cost $3.50, have a life of nine years, and use about $1.60 of electricity a year, paid at the end of each year.
- Conventional light bulbs cost only $0.50, but last only about a year and use about $6.60 of energy a year, paid at the end of each year.
The real discount rate is 5%, given as an effective annual rate. Assume that all cash flows are real. The inflation rate is 3% given as an effective annual rate.
Find the Equivalent Annual Cost (EAC) of the low-energy and conventional light bulbs. The below choices are listed in that order.
Question 213 income and capital returns, bond pricing, premium par and discount bonds
The coupon rate of a fixed annual-coupon bond is constant (always the same).
What can you say about the income return (##r_\text{income}##) of a fixed annual coupon bond? Remember that:
###r_\text{total} = r_\text{income} + r_\text{capital}###
###r_\text{total, 0 to 1} = \frac{c_1}{p_0} + \frac{p_1-p_0}{p_0}###
Assume that there is no change in the bond's total annual yield to maturity from when it is issued to when it matures.
Select the most correct statement.
From its date of issue until maturity, the income return of a fixed annual coupon:
An asset's total expected return over the next year is given by:
###r_\text{total} = \dfrac{c_1+p_1-p_0}{p_0} ###
Where ##p_0## is the current price, ##c_1## is the expected income in one year and ##p_1## is the expected price in one year. The total return can be split into the income return and the capital return.
Which of the following is the expected capital return?
The below graph shows a project's net present value (NPV) against its annual discount rate.
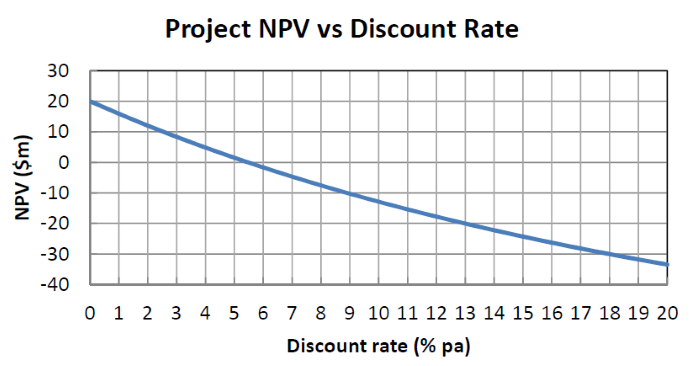
Which of the following statements is NOT correct?
Question 573 bond pricing, zero coupon bond, term structure of interest rates, expectations hypothesis, liquidity premium theory, forward interest rate, yield curve
In the below term structure of interest rates equation, all rates are effective annual yields and the numbers in subscript represent the years that the yields are measured over:
###(1+r_{0-3})^3 = (1+r_{0-1})(1+r_{1-2})(1+r_{2-3}) ###
Which of the following statements is NOT correct?
The standard deviation of monthly changes in the spot price of corn is 50 cents per bushel. The standard deviation of monthly changes in the futures price of corn is 40 cents per bushel. The correlation between the spot price of corn and the futures price of corn is 0.9.
It is now March. A corn chip manufacturer is committed to buying 250,000 bushels of corn in May. The spot price of corn is 381 cents per bushel and the June futures price is 399 cents per bushel.
The corn chip manufacturer wants to use the June corn futures contracts to hedge his risk. Each futures contract is for the delivery of 5,000 bushels of corn. One bushel is about 127 metric tons.
How many corn futures should the corn chip manufacturer buy to hedge his risk? Round your answer to the nearest whole number of contracts. Remember to tail the hedge.
Question 850 gross domestic product, gross domestic product per capita
Below is a table showing some countries’ GDP, population and GDP per capita.
| Countries' GDP and Population | |||
| GDP | Population | GDP per capita | |
| USD million | millions of people | USD | |
| United States | 18,036,648 | 325 | 55,492 |
| China | 11,158,457 | 1,383 | 8,066 |
| Japan | 4,383,076 | 127 | 34,586 |
| Germany | 3,363,600 | 83 | 40,623 |
| Norway | 500,519 | 5 | 95,027 |
Source: "GDP and its breakdown at current prices in US Dollars" United Nations Statistics Division. December 2016.
Using this data only, which one of these countries’ citizens have the highest living standards?
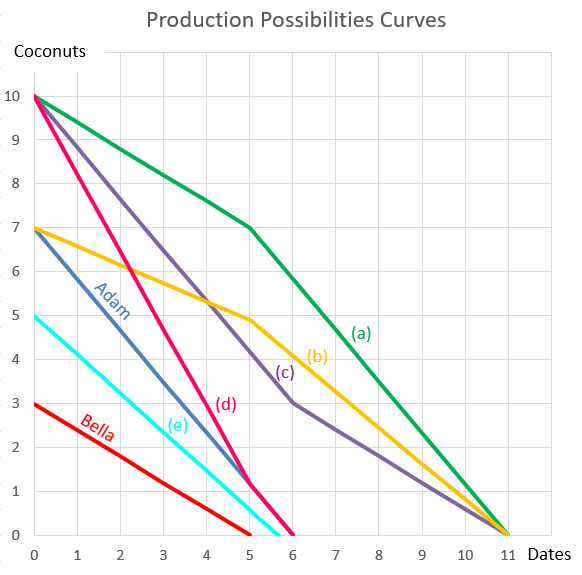
Question 898 comparative advantage in trade, production possibilities curve, no explanation
Adam and Bella are the only people on a remote island. Their production possibility curves are shown in the graph.
Assuming that Adam and Bella cooperate according to the principles of comparative advantage, what will be their combined production possibilities curve?