A share was bought for $30 (at t=0) and paid its annual dividend of $6 one year later (at t=1).
Just after the dividend was paid, the share price fell to $27 (at t=1). What were the total, capital and income returns given as effective annual rates?
The choices are given in the same order:
##r_\text{total}## , ##r_\text{capital}## , ##r_\text{dividend}##.
A stock is expected to pay the following dividends:
| Cash Flows of a Stock | ||||||
| Time (yrs) | 0 | 1 | 2 | 3 | 4 | ... |
| Dividend ($) | 0 | 6 | 12 | 18 | 20 | ... |
After year 4, the dividend will grow in perpetuity at 5% pa. The required return of the stock is 10% pa. Both the growth rate and required return are given as effective annual rates.
If all of the dividends since time period zero were deposited into a bank account yielding 8% pa as an effective annual rate, how much money will be in the bank account in 2.5 years (in other words, at t=2.5)?
You just started work at your new job which pays $48,000 per year.
The human resources department have given you the option of being paid at the end of every week or every month.
Assume that there are 4 weeks per month, 12 months per year and 48 weeks per year.
Bank interest rates are 12% pa given as an APR compounding per month.
What is the dollar gain over one year, as a net present value, of being paid every week rather than every month?
Question 320 foreign exchange rate, monetary policy, American and European terms
Investors expect the Reserve Bank of Australia (RBA) to decrease the overnight cash rate at their next meeting.
Then unexpectedly, the RBA announce that they will keep the policy rate unchanged.
What do you expect to happen to Australia's exchange rate in the short term? The Australian dollar is likely to:
The below screenshot of Microsoft's (MSFT) details were taken from the Google Finance website on 28 Nov 2014. Some information has been deliberately blanked out.
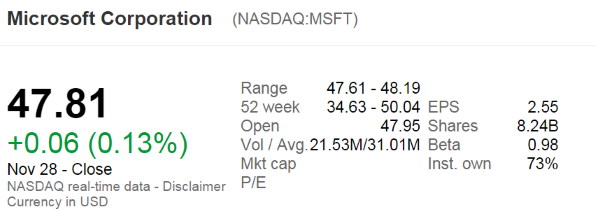
What was MSFT's market capitalisation of equity?
Which of the following equations is NOT equal to the total return of an asset?
Let ##p_0## be the current price, ##p_1## the expected price in one year and ##c_1## the expected income in one year.
Question 740 real and nominal returns and cash flows, DDM, inflation
Taking inflation into account when using the DDM can be hard. Which of the following formulas will NOT give a company's current stock price ##(P_0)##? Assume that the annual dividend was just paid ##(C_0)##, and the next dividend will be paid in one year ##(C_1)##.
Question 748 income and capital returns, DDM, ex dividend date
A stock will pay you a dividend of $2 tonight if you buy it today.
Thereafter the annual dividend is expected to grow by 3% pa, so the next dividend after the $2 one tonight will be $2.06 in one year, then in two years it will be $2.1218 and so on. The stock's required return is 8% pa.
What is the stock price today and what do you expect the stock price to be tomorrow, approximately?
Question 920 SML, CAPM, Sharpe ratio, Treynor ratio, Jensens alpha, no explanation
Over-priced assets should NOT:
Question 948 VaR, expected shortfall
Below is a historical sample of returns on the S&P500 capital index.
| S&P500 Capital Index Daily Returns Ranked from Best to Worst |
||
| 10,000 trading days from 4th August 1977 to 24 March 2017 based on closing prices. |
||
| Rank | Date (DD-MM-YY) |
Continuously compounded daily return (% per day) |
| 1 | 21-10-87 | 9.23 |
| 2 | 08-03-83 | 8.97 |
| 3 | 13-11-08 | 8.3 |
| 4 | 30-09-08 | 8.09 |
| 5 | 28-10-08 | 8.01 |
| 6 | 29-10-87 | 7.28 |
| … | … | … |
| 9980 | 11-12-08 | -5.51 |
| 9981 | 22-10-08 | -5.51 |
| 9982 | 08-08-11 | -5.54 |
| 9983 | 22-09-08 | -5.64 |
| 9984 | 11-09-86 | -5.69 |
| 9985 | 30-11-87 | -5.88 |
| 9986 | 14-04-00 | -5.99 |
| 9987 | 07-10-98 | -6.06 |
| 9988 | 08-01-88 | -6.51 |
| 9989 | 27-10-97 | -6.55 |
| 9990 | 13-10-89 | -6.62 |
| 9991 | 15-10-08 | -6.71 |
| 9992 | 29-09-08 | -6.85 |
| 9993 | 07-10-08 | -6.91 |
| 9994 | 14-11-08 | -7.64 |
| 9995 | 01-12-08 | -7.79 |
| 9996 | 29-10-08 | -8.05 |
| 9997 | 26-10-87 | -8.4 |
| 9998 | 31-08-98 | -8.45 |
| 9999 | 09-10-08 | -12.9 |
| 10000 | 19-10-87 | -23.36 |
| Mean of all 10,000: | 0.0354 | |
| Sample standard deviation of all 10,000: | 1.2062 | |
| Sources: Bloomberg and S&P. | ||
Assume that the one-tail Z-statistic corresponding to a probability of 99.9% is exactly 3.09. Which of the following statements is NOT correct? Based on the historical data, the 99.9% daily: