Question 155 inflation, real and nominal returns and cash flows, Loan, effective rate conversion
You are a banker about to grant a 2 year loan to a customer. The loan's principal and interest will be repaid in a single payment at maturity, sometimes called a zero-coupon loan, discount loan or bullet loan.
You require a real return of 6% pa over the two years, given as an effective annual rate. Inflation is expected to be 2% this year and 4% next year, both given as effective annual rates.
You judge that the customer can afford to pay back $1,000,000 in 2 years, given as a nominal cash flow. How much should you lend to her right now?
Find Candys Corporation's Cash Flow From Assets (CFFA), also known as Free Cash Flow to the Firm (FCFF), over the year ending 30th June 2013.
| Candys Corp | ||
| Income Statement for | ||
| year ending 30th June 2013 | ||
| $m | ||
| Sales | 200 | |
| COGS | 50 | |
| Operating expense | 10 | |
| Depreciation | 20 | |
| Interest expense | 10 | |
| Income before tax | 110 | |
| Tax at 30% | 33 | |
| Net income | 77 | |
| Candys Corp | ||
| Balance Sheet | ||
| as at 30th June | 2013 | 2012 |
| $m | $m | |
| Assets | ||
| Current assets | 220 | 180 |
| PPE | ||
| Cost | 300 | 340 |
| Accumul. depr. | 60 | 40 |
| Carrying amount | 240 | 300 |
| Total assets | 460 | 480 |
| Liabilities | ||
| Current liabilities | 175 | 190 |
| Non-current liabilities | 135 | 130 |
| Owners' equity | ||
| Retained earnings | 50 | 60 |
| Contributed equity | 100 | 100 |
| Total L and OE | 460 | 480 |
Note: all figures are given in millions of dollars ($m).
Find Trademark Corporation's Cash Flow From Assets (CFFA), also known as Free Cash Flow to the Firm (FCFF), over the year ending 30th June 2013.
| Trademark Corp | ||
| Income Statement for | ||
| year ending 30th June 2013 | ||
| $m | ||
| Sales | 100 | |
| COGS | 25 | |
| Operating expense | 5 | |
| Depreciation | 20 | |
| Interest expense | 20 | |
| Income before tax | 30 | |
| Tax at 30% | 9 | |
| Net income | 21 | |
| Trademark Corp | ||
| Balance Sheet | ||
| as at 30th June | 2013 | 2012 |
| $m | $m | |
| Assets | ||
| Current assets | 120 | 80 |
| PPE | ||
| Cost | 150 | 140 |
| Accumul. depr. | 60 | 40 |
| Carrying amount | 90 | 100 |
| Total assets | 210 | 180 |
| Liabilities | ||
| Current liabilities | 75 | 65 |
| Non-current liabilities | 75 | 55 |
| Owners' equity | ||
| Retained earnings | 10 | 10 |
| Contributed equity | 50 | 50 |
| Total L and OE | 210 | 180 |
Note: all figures are given in millions of dollars ($m).
A firm has forecast its Cash Flow From Assets (CFFA) for this year and management is worried that it is too low. Which one of the following actions will lead to a higher CFFA for this year (t=0 to 1)? Only consider cash flows this year. Do not consider cash flows after one year, or the change in the NPV of the firm. Consider each action in isolation.
A new company's Firm Free Cash Flow (FFCF, same as CFFA) is forecast in the graph below.
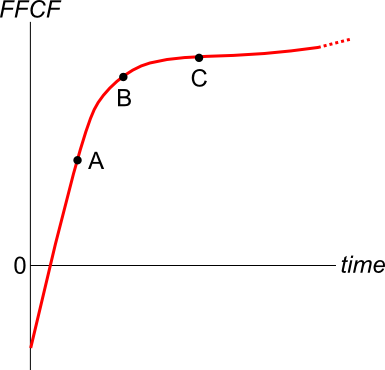
To value the firm's assets, the terminal value needs to be calculated using the perpetuity with growth formula:
###V_{\text{terminal, }t-1} = \dfrac{FFCF_{\text{terminal, }t}}{r-g}###
Which point corresponds to the best time to calculate the terminal value?
Which of the following investable assets are NOT suitable for valuation using PE multiples techniques?
Which of the following investable assets is the LEAST suitable for valuation using PE multiples techniques?
A stock is expected to pay its first dividend of $20 in 3 years (t=3), which it will continue to pay for the next nine years, so there will be ten $20 payments altogether with the last payment in year 12 (t=12).
From the thirteenth year onward, the dividend is expected to be 4% more than the previous year, forever. So the dividend in the thirteenth year (t=13) will be $20.80, then $21.632 in year 14, and so on forever. The required return of the stock is 10% pa. All rates are effective annual rates. Calculate the current (t=0) stock price.
Question 809 Markowitz portfolio theory, CAPM, Jensens alpha, CML, systematic and idiosyncratic risk
A graph of assets’ expected returns ##(\mu)## versus standard deviations ##(\sigma)## is given in the graph below. The CML is the capital market line.
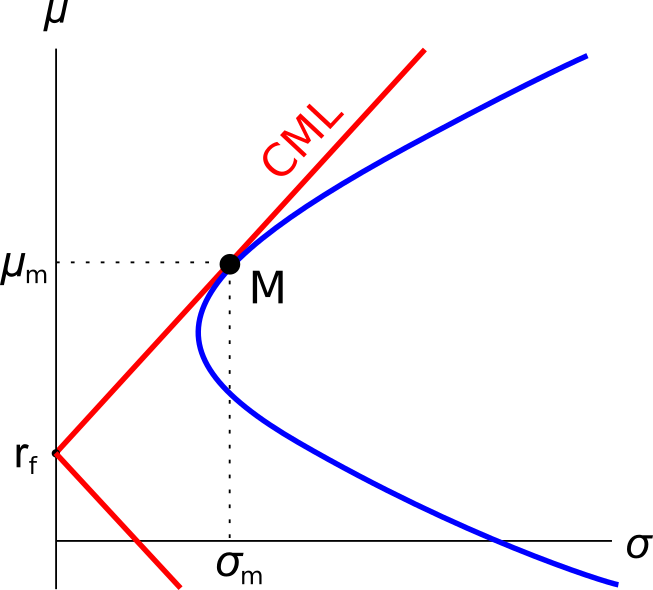
Which of the following statements about this graph, Markowitz portfolio theory and the Capital Asset Pricing Model (CAPM) theory is NOT correct?
Which one of the following statements is NOT correct? A 1-for-4 bonus issue: