A stock pays annual dividends. It just paid a dividend of $3. The growth rate in the dividend is 4% pa. You estimate that the stock's required return is 10% pa. Both the discount rate and growth rate are given as effective annual rates. Using the dividend discount model, what will be the share price?
Question 490 expected and historical returns, accounting ratio
Which of the following is NOT a synonym of 'required return'?
The price of gold is currently $700 per ounce. The forward price for delivery in 1 year is $800. An arbitrageur can borrow money at 10% per annum given as an effective discrete annual rate. Assume that gold is fairly priced and the cost of storing gold is zero.
What is the best way to conduct an arbitrage in this situation? The best arbitrage strategy requires zero capital, has zero risk and makes money straight away. An arbitrageur should sell 1 forward on gold and:
Question 719 mean and median returns, return distribution, arithmetic and geometric averages, continuously compounding rate
A stock has an arithmetic average continuously compounded return (AALGDR) of 10% pa, a standard deviation of continuously compounded returns (SDLGDR) of 80% pa and current stock price of $1. Assume that stock prices are log-normally distributed. The graph below summarises this information and provides some helpful formulas.
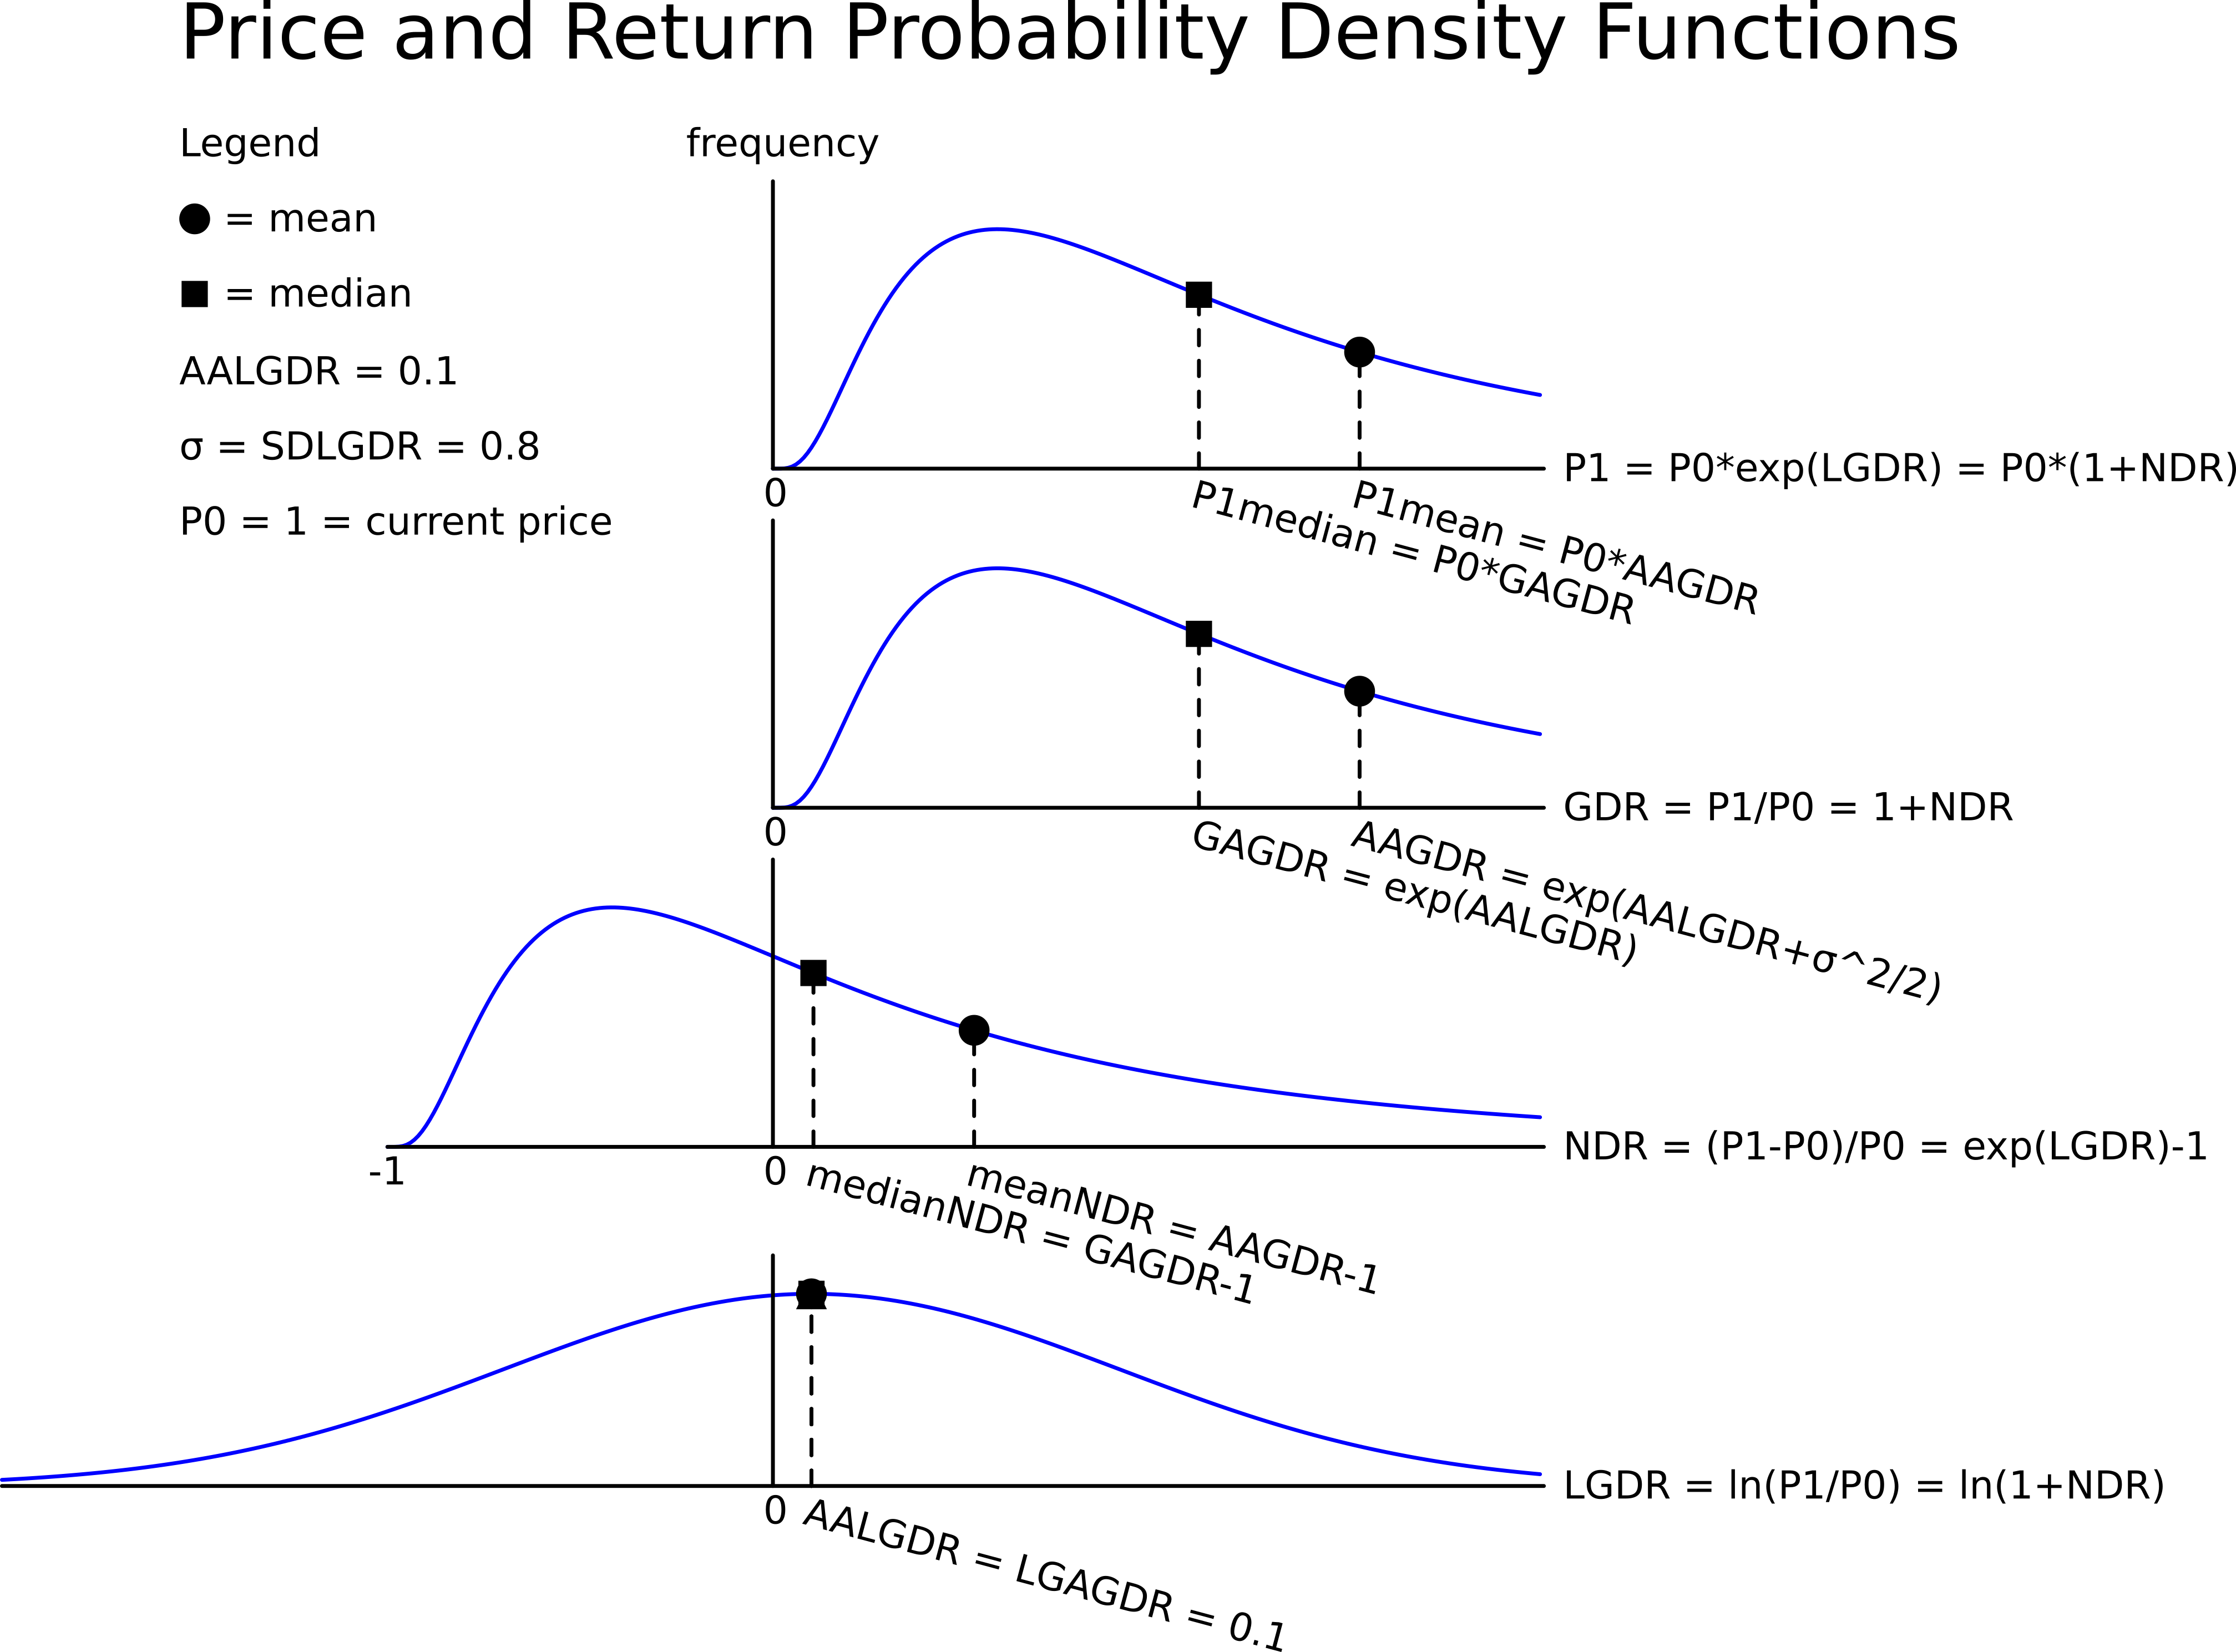
In one year, what do you expect the median and mean prices to be? The answer options are given in the same order.
Question 730 DDM, income and capital returns, no explanation
A stock’s current price is $1. Its expected total return is 10% pa and its long term expected capital return is 4% pa. It pays an annual dividend and the next one will be paid in one year. All rates are given as effective annual rates. The dividend discount model is thought to be a suitable model for the stock. Ignore taxes. Which of the following statements about the stock is NOT correct?
Question 809 Markowitz portfolio theory, CAPM, Jensens alpha, CML, systematic and idiosyncratic risk
A graph of assets’ expected returns ##(\mu)## versus standard deviations ##(\sigma)## is given in the graph below. The CML is the capital market line.
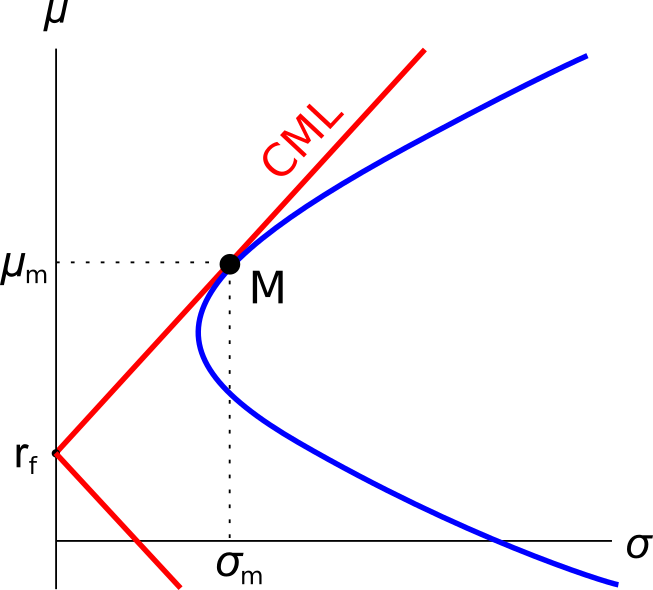
Which of the following statements about this graph, Markowitz portfolio theory and the Capital Asset Pricing Model (CAPM) theory is NOT correct?
Calculate Australia’s GDP over the 2016 calendar year using the below table:
| Australian Gross Domestic Product Components | ||||
| A$ billion, 2016 Calendar Year from 1 Jan 2016 to 31 Dec 2016 inclusive | ||||
| Consumption | Investment | Government spending | Exports | Imports |
| 971 | 421 | 320 | 328 | 344 |
Source: ABS 5206.0 Australian National Accounts: National Income, Expenditure and Product. Table 3. Expenditure on Gross Domestic Product (GDP), Current prices.
Over the 2016 calendar year, Australia’s GDP was: