A three year bond has a face value of $100, a yield of 10% and a fixed coupon rate of 5%, paid semi-annually. What is its price?
A managed fund charges fees based on the amount of money that you keep with them. The fee is 2% of the start-of-year amount, but it is paid at the end of every year.
This fee is charged regardless of whether the fund makes gains or losses on your money.
The fund offers to invest your money in shares which have an expected return of 10% pa before fees.
You are thinking of investing $100,000 in the fund and keeping it there for 40 years when you plan to retire.
What is the Net Present Value (NPV) of investing your money in the fund? Note that the question is not asking how much money you will have in 40 years, it is asking: what is the NPV of investing in the fund? Assume that:
- The fund has no private information.
- Markets are weak and semi-strong form efficient.
- The fund's transaction costs are negligible.
- The cost and trouble of investing your money in shares by yourself, without the managed fund, is negligible.
Two years ago Fred bought a house for $300,000.
Now it's worth $500,000, based on recent similar sales in the area.
Fred's residential property has an expected total return of 8% pa.
He rents his house out for $2,000 per month, paid in advance. Every 12 months he plans to increase the rental payments.
The present value of 12 months of rental payments is $23,173.86.
The future value of 12 months of rental payments one year ahead is $25,027.77.
What is the expected annual growth rate of the rental payments? In other words, by what percentage increase will Fred have to raise the monthly rent by each year to sustain the expected annual total return of 8%?
One formula for calculating a levered firm's free cash flow (FFCF, or CFFA) is to use earnings before interest and tax (EBIT).
###\begin{aligned} FFCF &= (EBIT)(1-t_c) + Depr - CapEx -\Delta NWC + IntExp.t_c \\ &= (Rev - COGS - Depr - FC)(1-t_c) + Depr - CapEx -\Delta NWC + IntExp.t_c \\ \end{aligned} \\###
Question 556 portfolio risk, portfolio return, standard deviation
An investor wants to make a portfolio of two stocks A and B with a target expected portfolio return of 12% pa.
- Stock A has an expected return of 10% pa and a standard deviation of 20% pa.
- Stock B has an expected return of 15% pa and a standard deviation of 30% pa.
The correlation coefficient between stock A and B's expected returns is 70%.
What will be the annual standard deviation of the portfolio with this 12% pa target return?
Question 834 option, delta, theta, gamma, standard deviation, Black-Scholes-Merton option pricing
Which of the following statements about an option (either a call or put) and its underlying stock is NOT correct?
| European Call Option | ||
| on a non-dividend paying stock | ||
| Description | Symbol | Quantity |
| Spot price ($) | ##S_0## | 20 |
| Strike price ($) | ##K_T## | 18 |
| Risk free cont. comp. rate (pa) | ##r## | 0.05 |
| Standard deviation of the stock's cont. comp. returns (pa) | ##\sigma## | 0.3 |
| Option maturity (years) | ##T## | 1 |
| Call option price ($) | ##c_0## | 3.939488 |
| Delta | ##\Delta = N[d_1]## | 0.747891 |
| ##N[d_2]## | ##N[d_2]## | 0.643514 |
| Gamma | ##\Gamma## | 0.053199 |
| Theta ($/year) | ##\Theta = \partial c / \partial T## | 1.566433 |
Question 889 cross currency interest rate parity, no explanation
Judging by the graph, in 2018 the USD short term interest rate set by the US Federal Reserve is higher than the JPY short term interest rate set by the Bank of Japan, which is higher than the EUR short term interest rate set by the European central bank.
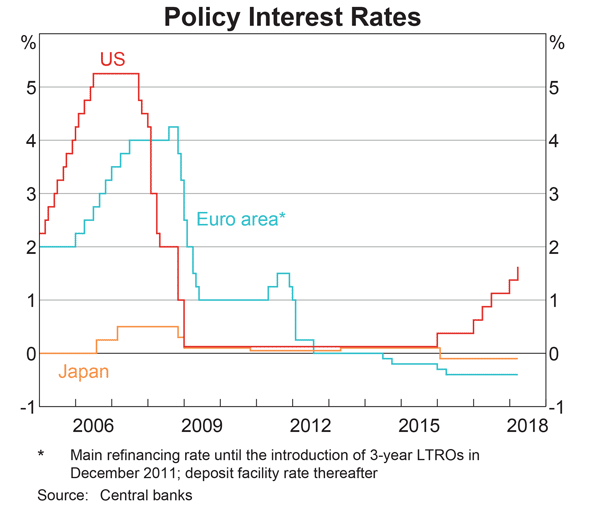
At the latest date shown in 2018: ##r_{USD}>r_{JPY}>r_{EUR}##
Assume that each currency’s yield curve is flat at the latest date shown in 2018, so interest rates are expected to remain at their current level into the future.
Which of the following statements is NOT correct?
Over time you would expect the: