Find Candys Corporation's Cash Flow From Assets (CFFA), also known as Free Cash Flow to the Firm (FCFF), over the year ending 30th June 2013.
| Candys Corp | ||
| Income Statement for | ||
| year ending 30th June 2013 | ||
| $m | ||
| Sales | 200 | |
| COGS | 50 | |
| Operating expense | 10 | |
| Depreciation | 20 | |
| Interest expense | 10 | |
| Income before tax | 110 | |
| Tax at 30% | 33 | |
| Net income | 77 | |
| Candys Corp | ||
| Balance Sheet | ||
| as at 30th June | 2013 | 2012 |
| $m | $m | |
| Assets | ||
| Current assets | 220 | 180 |
| PPE | ||
| Cost | 300 | 340 |
| Accumul. depr. | 60 | 40 |
| Carrying amount | 240 | 300 |
| Total assets | 460 | 480 |
| Liabilities | ||
| Current liabilities | 175 | 190 |
| Non-current liabilities | 135 | 130 |
| Owners' equity | ||
| Retained earnings | 50 | 60 |
| Contributed equity | 100 | 100 |
| Total L and OE | 460 | 480 |
Note: all figures are given in millions of dollars ($m).
Which firms tend to have low forward-looking price-earnings (PE) ratios?
Only consider firms with positive earnings, disregard firms with negative earnings and therefore negative PE ratios.
Estimate the Chinese bank ICBC's share price using a backward-looking price earnings (PE) multiples approach with the following assumptions and figures only. Note that the renminbi (RMB) is the Chinese currency, also known as the yuan (CNY).
- The 4 major Chinese banks ICBC, China Construction Bank (CCB), Bank of China (BOC) and Agricultural Bank of China (ABC) are comparable companies;
- ICBC 's historical earnings per share (EPS) is RMB 0.74;
- CCB's backward-looking PE ratio is 4.59;
- BOC 's backward-looking PE ratio is 4.78;
- ABC's backward-looking PE ratio is also 4.78;
Note: Figures sourced from Google Finance on 25 March 2014. Share prices are from the Shanghai stock exchange.
Which one of the following will have no effect on net income (NI) but decrease cash flow from assets (CFFA or FFCF) in this year for a tax-paying firm, all else remaining constant?
Remember:
###NI=(Rev-COGS-FC-Depr-IntExp).(1-t_c )### ###CFFA=NI+Depr-CapEx - ΔNWC+IntExp###Question 447 payout policy, corporate financial decision theory
Payout policy is most closely related to which part of a business?
The price of gold is currently $700 per ounce. The forward price for delivery in 1 year is $800. An arbitrageur can borrow money at 10% per annum given as an effective discrete annual rate. Assume that gold is fairly priced and the cost of storing gold is zero.
What is the best way to conduct an arbitrage in this situation? The best arbitrage strategy requires zero capital, has zero risk and makes money straight away. An arbitrageur should sell 1 forward on gold and:
Question 667 forward foreign exchange rate, foreign exchange rate, cross currency interest rate parity, no explanation
The Australian cash rate is expected to be 2% pa over the next one year, while the US cash rate is expected to be 0% pa, both given as nominal effective annual rates. The current exchange rate is 0.73 USD per AUD.
What is the implied 1 year USD per AUD forward foreign exchange rate?
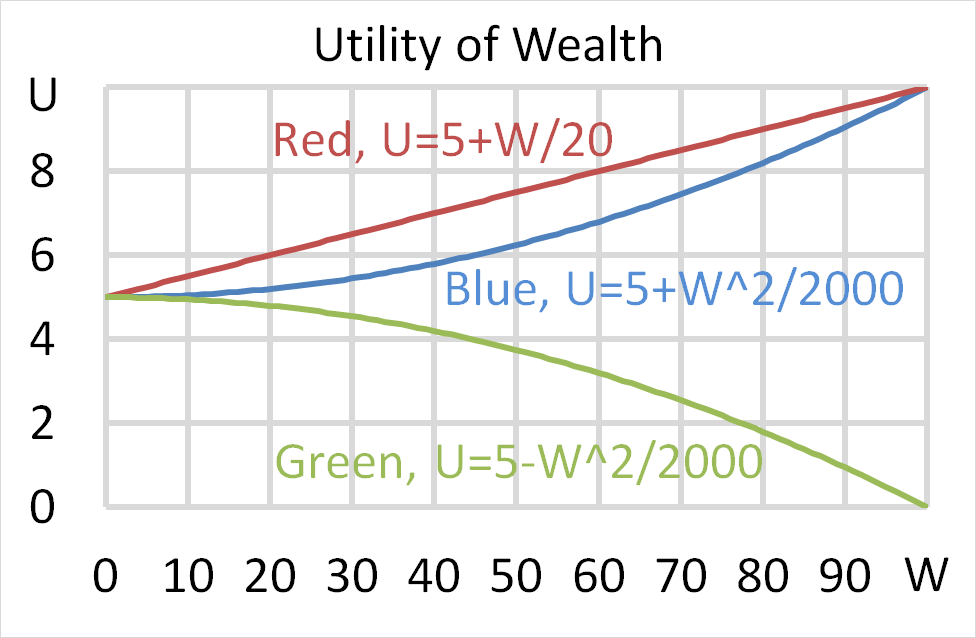
Question 701 utility, risk aversion, utility function, gamble
Mr Blue, Miss Red and Mrs Green are people with different utility functions.
Each person has $50 of initial wealth. A coin toss game is offered to each person at a casino where the player can win or lose $50. Each player can flip a coin and if they flip heads, they receive $50. If they flip tails then they will lose $50. Which of the following statements is NOT correct?
Question 710 continuously compounding rate, continuously compounding rate conversion
A continuously compounded monthly return of 1% ##(r_\text{cc monthly})## is equivalent to a continuously compounded annual return ##(r_\text{cc annual})## of:
Below is the Australian federal government’s budget balance as a percent of GDP. Note that the columns to the right of the vertical black line were a forecast at the time. The x-axis shows financial years, so for example the 06/07 financial year represents the time period from 1 July 2006 to 30 June 2007.
Comparing the 2008/09 financial year to the previous one, the Australian federal government implemented: