A project has the following cash flows. Normally cash flows are assumed to happen at the given time. But here, assume that the cash flows are received smoothly over the year. So the $250 at time 2 is actually earned smoothly from t=1 to t=2:
| Project Cash Flows | |
| Time (yrs) | Cash flow ($) |
| 0 | -400 |
| 1 | 200 |
| 2 | 250 |
What is the payback period of the project in years?
The first payment of a constant perpetual annual cash flow is received at time 5. Let this cash flow be ##C_5## and the required return be ##r##.
So there will be equal annual cash flows at time 5, 6, 7 and so on forever, and all of the cash flows will be equal so ##C_5 = C_6 = C_7 = ...##
When the perpetuity formula is used to value this stream of cash flows, it will give a value (V) at time:
A share currently worth $100 is expected to pay a constant dividend of $4 for the next 5 years with the first dividend in one year (t=1) and the last in 5 years (t=5).
The total required return is 10% pa.
What do you expected the share price to be in 5 years, just after the dividend at that time has been paid?
An American wishes to convert USD 1 million to Australian dollars (AUD). The exchange rate is 0.8 USD per AUD. How much is the USD 1 million worth in AUD?
The current gold price is $700, gold storage costs are 2% pa and the risk free rate is 10% pa, both with continuous compounding.
What should be the 3 year gold futures price?
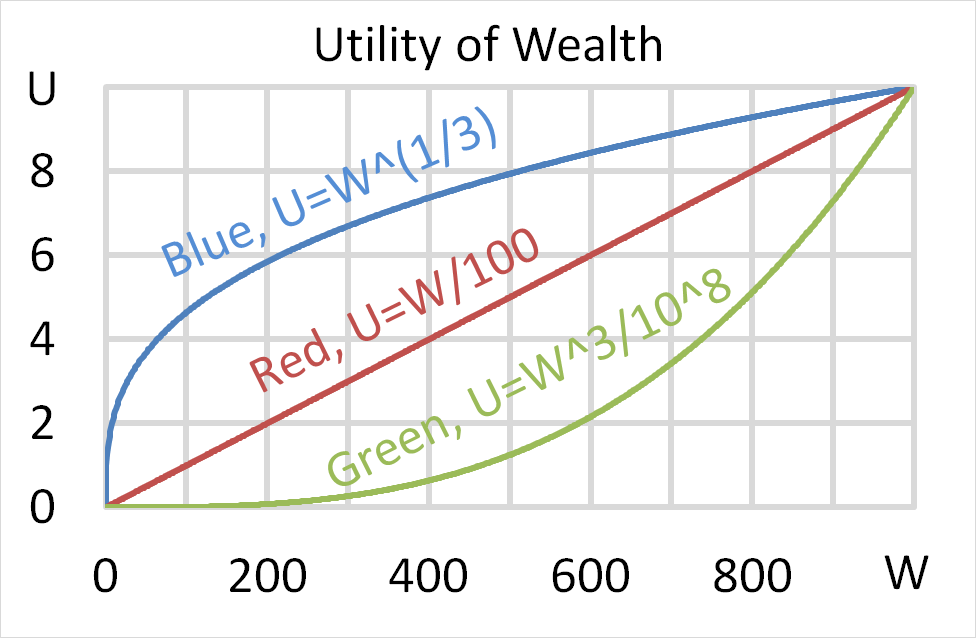
Question 703 utility, risk aversion, utility function, gamble
Mr Blue, Miss Red and Mrs Green are people with different utility functions.
Each person has $500 of initial wealth. A coin toss game is offered to each person at a casino where the player can win or lose $500. Each player can flip a coin and if they flip heads, they receive $500. If they flip tails then they will lose $500. Which of the following statements is NOT correct?
Which of the following quantities is commonly assumed to be normally distributed?
Question 809 Markowitz portfolio theory, CAPM, Jensens alpha, CML, systematic and idiosyncratic risk
A graph of assets’ expected returns ##(\mu)## versus standard deviations ##(\sigma)## is given in the graph below. The CML is the capital market line.
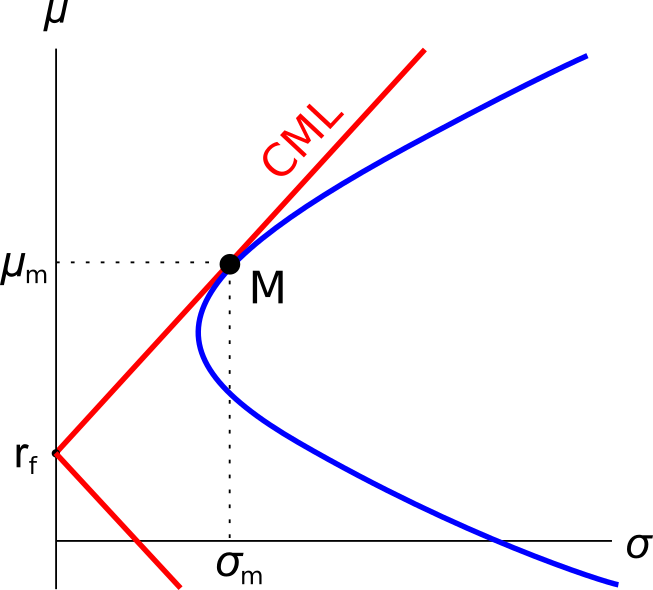
Which of the following statements about this graph, Markowitz portfolio theory and the Capital Asset Pricing Model (CAPM) theory is NOT correct?
Question 850 gross domestic product, gross domestic product per capita
Below is a table showing some countries’ GDP, population and GDP per capita.
| Countries' GDP and Population | |||
| GDP | Population | GDP per capita | |
| USD million | millions of people | USD | |
| United States | 18,036,648 | 325 | 55,492 |
| China | 11,158,457 | 1,383 | 8,066 |
| Japan | 4,383,076 | 127 | 34,586 |
| Germany | 3,363,600 | 83 | 40,623 |
| Norway | 500,519 | 5 | 95,027 |
Source: "GDP and its breakdown at current prices in US Dollars" United Nations Statistics Division. December 2016.
Using this data only, which one of these countries’ citizens have the highest living standards?
Question 897 comparative advantage in trade, production possibilities curve, no explanation
Adam and Bella are the only people on a remote island. Their production possibility curves are shown in the graph.
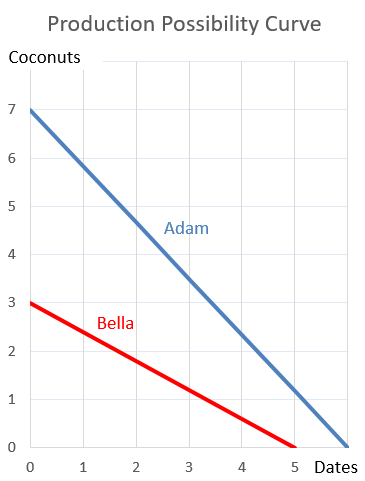
Which of the following statements is NOT correct?