Why is Capital Expenditure (CapEx) subtracted in the Cash Flow From Assets (CFFA) formula?
###CFFA=NI+Depr-CapEx - \Delta NWC+IntExp###
A share pays annual dividends. It just paid a dividend of $2. The growth rate in the dividend is 3% pa. You estimate that the stock's required return is 8% pa. Both the discount rate and growth rate are given as effective annual rates.
Using the dividend discount model, what is the share price?
In the dividend discount model:
###P_0 = \dfrac{C_1}{r-g}###
The return ##r## is supposed to be the:
A man is thinking about taking a day off from his casual painting job to relax.
He just woke up early in the morning and he's about to call his boss to say that he won't be coming in to work.
But he's thinking about the hours that he could work today (in the future) which are:
Estimate the French bank Societe Generale's share price using a backward-looking price earnings (PE) multiples approach with the following assumptions and figures only. Note that EUR is the euro, the European monetary union's currency.
- The 4 major European banks Credit Agricole (ACA), Deutsche Bank AG (DBK), UniCredit (UCG) and Banco Santander (SAN) are comparable companies to Societe Generale (GLE);
- Societe Generale's (GLE's) historical earnings per share (EPS) is EUR 2.92;
- ACA's backward-looking PE ratio is 16.29 and historical EPS is EUR 0.84;
- DBK's backward-looking PE ratio is 25.01 and historical EPS is EUR 1.26;
- SAN's backward-looking PE ratio is 14.71 and historical EPS is EUR 0.47;
- UCG's backward-looking PE ratio is 15.78 and historical EPS is EUR 0.40;
Note: Figures sourced from Google Finance on 27 March 2015.
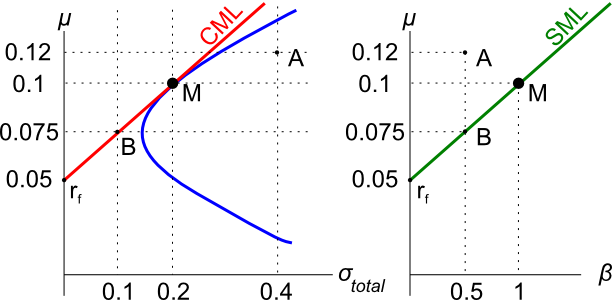
Assets A, B, M and ##r_f## are shown on the graphs above. Asset M is the market portfolio and ##r_f## is the risk free yield on government bonds. Which of the below statements is NOT correct?
A $100 stock has a continuously compounded expected total return of 10% pa. Its dividend yield is 2% pa with continuous compounding. What do you expect its price to be in 2.5 years?
Question 810 CAPM, systematic and idiosyncratic risk, market efficiency
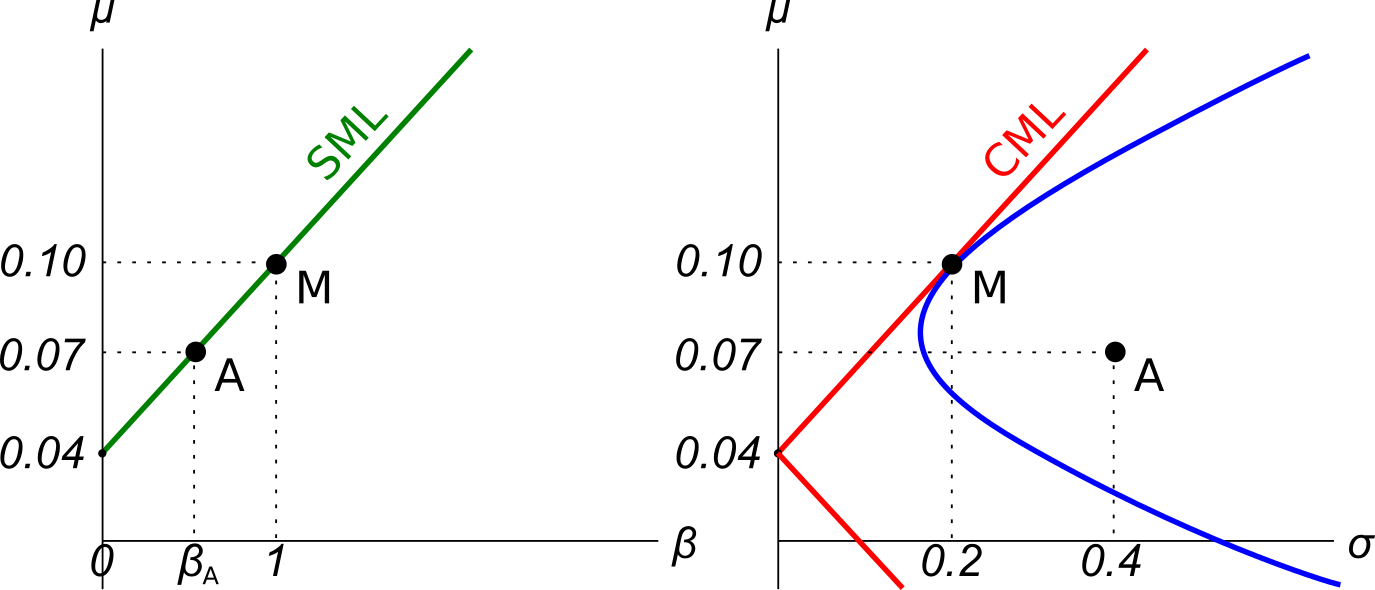
Examine the graphs below. Assume that asset A is a single stock. Which of the following statements is NOT correct? Asset A:
Question 926 mean and median returns, return distribution, arithmetic and geometric averages, continuously compounding rate
The arithmetic average continuously compounded or log gross discrete return (AALGDR) on the ASX200 accumulation index over the 24 years from 31 Dec 1992 to 31 Dec 2016 is 9.49% pa.
The arithmetic standard deviation (SDLGDR) is 16.92 percentage points pa.
Assume that the log gross discrete returns are normally distributed and that the above estimates are true population statistics, not sample statistics, so there is no standard error in the sample mean or standard deviation estimates. Also assume that the standardised normal Z-statistic corresponding to a one-tail probability of 2.5% is exactly -1.96.
If you had a $1 million fund that replicated the ASX200 accumulation index, in how many years would the median dollar value of your fund first be expected to lie outside the 95% confidence interval forecast?
A stock has an expected return of 10% pa and you're 90% sure that over the next year, the return will be between -15% and 35%. The stock's returns are normally distributed. Note that the Z-statistic corresponding to a one-tail:
- 90% normal probability density function is 1.282.
- 95% normal probability density function is 1.645.
- 97.5% normal probability density function is 1.960.
What is the stock’s standard deviation of returns in percentage points per annum (pp pa)?