A firm wishes to raise $20 million now. They will issue 8% pa semi-annual coupon bonds that will mature in 5 years and have a face value of $100 each. Bond yields are 6% pa, given as an APR compounding every 6 months, and the yield curve is flat.
How many bonds should the firm issue?
Question 180 equivalent annual cash flow, inflation, real and nominal returns and cash flows
Details of two different types of light bulbs are given below:
- Low-energy light bulbs cost $3.50, have a life of nine years, and use about $1.60 of electricity a year, paid at the end of each year.
- Conventional light bulbs cost only $0.50, but last only about a year and use about $6.60 of energy a year, paid at the end of each year.
The real discount rate is 5%, given as an effective annual rate. Assume that all cash flows are real. The inflation rate is 3% given as an effective annual rate.
Find the Equivalent Annual Cost (EAC) of the low-energy and conventional light bulbs. The below choices are listed in that order.
A stock is expected to pay the following dividends:
| Cash Flows of a Stock | ||||||
| Time (yrs) | 0 | 1 | 2 | 3 | 4 | ... |
| Dividend ($) | 0 | 6 | 12 | 18 | 20 | ... |
After year 4, the dividend will grow in perpetuity at 5% pa. The required return of the stock is 10% pa. Both the growth rate and required return are given as effective annual rates.
What will be the price of the stock in 7 years (t = 7), just after the dividend at that time has been paid?
Private equity firms are known to buy medium sized private companies operating in the same industry, merge them together into a larger company, and then sell it off in a public float (initial public offering, IPO).
If medium-sized private companies trade at PE ratios of 5 and larger listed companies trade at PE ratios of 15, what return can be achieved from this strategy?
Assume that:
- The medium-sized companies can be bought, merged and sold in an IPO instantaneously.
- There are no costs of finding, valuing, merging and restructuring the medium sized companies. Also, there is no competition to buy the medium-sized companies from other private equity firms.
- The large merged firm's earnings are the sum of the medium firms' earnings.
- The only reason for the difference in medium and large firm's PE ratios is due to the illiquidity of the medium firms' shares.
- Return is defined as: ##r_{0→1} = (p_1-p_0+c_1)/p_0## , where time zero is just before the merger and time one is just after.
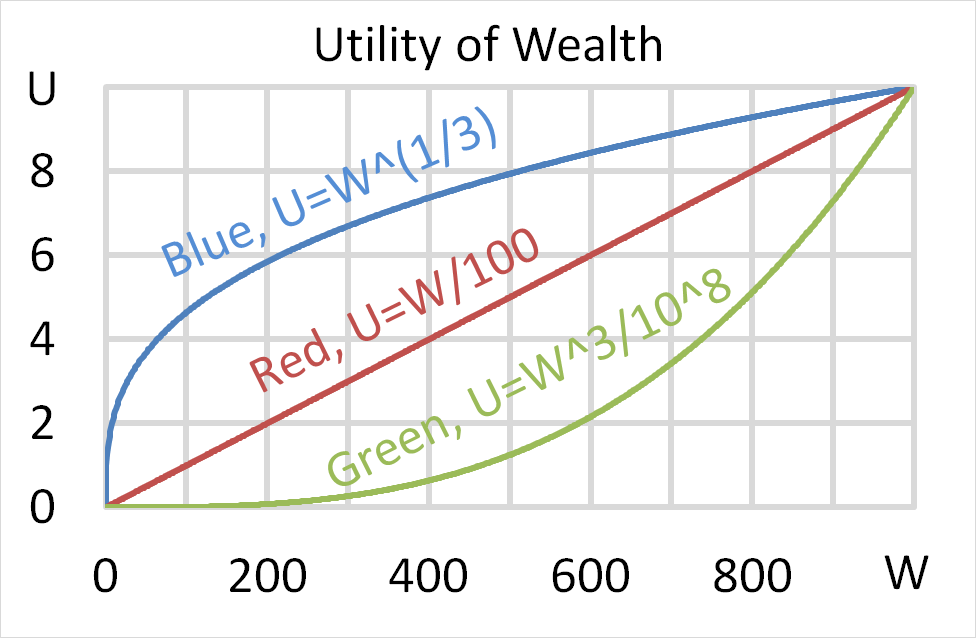
Question 704 utility, risk aversion, utility function, gamble
Mr Blue, Miss Red and Mrs Green are people with different utility functions.
Each person has $256 of initial wealth. A coin toss game is offered to each person at a casino where the player can win or lose $256. Each player can flip a coin and if they flip heads, they receive $256. If they flip tails then they will lose $256. Which of the following statements is NOT correct?
Question 811 log-normal distribution, mean and median returns, return distribution, arithmetic and geometric averages
Which of the following statements about probability distributions is NOT correct?
Below is the Australian federal government’s budget balance as a percent of GDP. Note that the columns to the right of the vertical black line were a forecast at the time. The x-axis shows financial years, so for example the 06/07 financial year represents the time period from 1 July 2006 to 30 June 2007.
Comparing the 2008/09 financial year to the previous one, the Australian federal government implemented: