A firm wishes to raise $20 million now. They will issue 8% pa semi-annual coupon bonds that will mature in 5 years and have a face value of $100 each. Bond yields are 6% pa, given as an APR compounding every 6 months, and the yield curve is flat.
How many bonds should the firm issue?
Find Sidebar Corporation's Cash Flow From Assets (CFFA), also known as Free Cash Flow to the Firm (FCFF), over the year ending 30th June 2013.
| Sidebar Corp | ||
| Income Statement for | ||
| year ending 30th June 2013 | ||
| $m | ||
| Sales | 405 | |
| COGS | 100 | |
| Depreciation | 34 | |
| Rent expense | 22 | |
| Interest expense | 39 | |
| Taxable Income | 210 | |
| Taxes at 30% | 63 | |
| Net income | 147 | |
| Sidebar Corp | ||
| Balance Sheet | ||
| as at 30th June | 2013 | 2012 |
| $m | $m | |
| Cash | 0 | 0 |
| Inventory | 70 | 50 |
| Trade debtors | 11 | 16 |
| Rent paid in advance | 4 | 3 |
| PPE | 700 | 680 |
| Total assets | 785 | 749 |
| Trade creditors | 11 | 19 |
| Bond liabilities | 400 | 390 |
| Contributed equity | 220 | 220 |
| Retained profits | 154 | 120 |
| Total L and OE | 785 | 749 |
Note: All figures are given in millions of dollars ($m).
The cash flow from assets was:
Acquirer firm plans to launch a takeover of Target firm. The deal is expected to create a present value of synergies totaling $105 million. A 40% scrip and 60% cash offer will be made that pays the fair price for the target's shares plus 75% of the total synergy value. The cash will be paid out of the firm's cash holdings, no new debt or equity will be raised.
| Firms Involved in the Takeover | ||
| Acquirer | Target | |
| Assets ($m) | 6,000 | 700 |
| Debt ($m) | 4,800 | 400 |
| Share price ($) | 40 | 20 |
| Number of shares (m) | 30 | 15 |
Ignore transaction costs and fees. Assume that the firms' debt and equity are fairly priced, and that each firms' debts' risk, yield and values remain constant. The acquisition is planned to occur immediately, so ignore the time value of money.
Calculate the merged firm's share price and total number of shares after the takeover has been completed.
Acquirer firm plans to launch a takeover of Target firm. The deal is expected to create a present value of synergies totaling $2 million. A cash offer will be made that pays the fair price for the target's shares plus 70% of the total synergy value. The cash will be paid out of the firm's cash holdings, no new debt or equity will be raised.
| Firms Involved in the Takeover | ||
| Acquirer | Target | |
| Assets ($m) | 60 | 10 |
| Debt ($m) | 20 | 2 |
| Share price ($) | 10 | 8 |
| Number of shares (m) | 4 | 1 |
Ignore transaction costs and fees. Assume that the firms' debt and equity are fairly priced, and that each firms' debts' risk, yield and values remain constant. The acquisition is planned to occur immediately, so ignore the time value of money.
Calculate the merged firm's share price and total number of shares after the takeover has been completed.
Question 577 inflation, real and nominal returns and cash flows
What is the present value of a real payment of $500 in 2 years? The nominal discount rate is 7% pa and the inflation rate is 4% pa.
A trader buys one crude oil futures contract on the CME expiring in one year with a locked-in futures price of $38.94 per barrel. If the trader doesn’t close out her contract before expiry then in one year she will have the:
Question 767 idiom, corporate financial decision theory, no explanation
The sayings "Don't cry over spilt milk", "Don't regret the things that you can't change" and "What's done is done" are most closely related to which financial concept?
Question 800 leverage, portfolio return, risk, portfolio risk, capital structure, no explanation
Which of the following assets would you expect to have the highest required rate of return? All values are current market values.
Question 809 Markowitz portfolio theory, CAPM, Jensens alpha, CML, systematic and idiosyncratic risk
A graph of assets’ expected returns ##(\mu)## versus standard deviations ##(\sigma)## is given in the graph below. The CML is the capital market line.
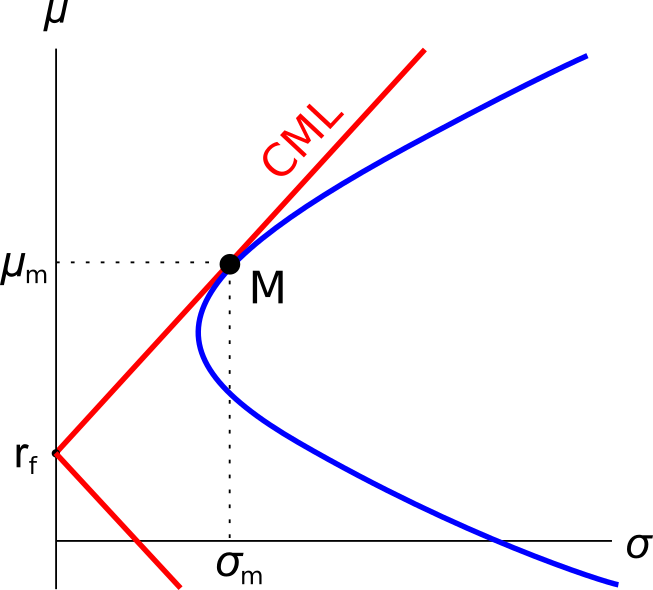
Which of the following statements about this graph, Markowitz portfolio theory and the Capital Asset Pricing Model (CAPM) theory is NOT correct?
Question 948 VaR, expected shortfall
Below is a historical sample of returns on the S&P500 capital index.
| S&P500 Capital Index Daily Returns Ranked from Best to Worst |
||
| 10,000 trading days from 4th August 1977 to 24 March 2017 based on closing prices. |
||
| Rank | Date (DD-MM-YY) |
Continuously compounded daily return (% per day) |
| 1 | 21-10-87 | 9.23 |
| 2 | 08-03-83 | 8.97 |
| 3 | 13-11-08 | 8.3 |
| 4 | 30-09-08 | 8.09 |
| 5 | 28-10-08 | 8.01 |
| 6 | 29-10-87 | 7.28 |
| … | … | … |
| 9980 | 11-12-08 | -5.51 |
| 9981 | 22-10-08 | -5.51 |
| 9982 | 08-08-11 | -5.54 |
| 9983 | 22-09-08 | -5.64 |
| 9984 | 11-09-86 | -5.69 |
| 9985 | 30-11-87 | -5.88 |
| 9986 | 14-04-00 | -5.99 |
| 9987 | 07-10-98 | -6.06 |
| 9988 | 08-01-88 | -6.51 |
| 9989 | 27-10-97 | -6.55 |
| 9990 | 13-10-89 | -6.62 |
| 9991 | 15-10-08 | -6.71 |
| 9992 | 29-09-08 | -6.85 |
| 9993 | 07-10-08 | -6.91 |
| 9994 | 14-11-08 | -7.64 |
| 9995 | 01-12-08 | -7.79 |
| 9996 | 29-10-08 | -8.05 |
| 9997 | 26-10-87 | -8.4 |
| 9998 | 31-08-98 | -8.45 |
| 9999 | 09-10-08 | -12.9 |
| 10000 | 19-10-87 | -23.36 |
| Mean of all 10,000: | 0.0354 | |
| Sample standard deviation of all 10,000: | 1.2062 | |
| Sources: Bloomberg and S&P. | ||
Assume that the one-tail Z-statistic corresponding to a probability of 99.9% is exactly 3.09. Which of the following statements is NOT correct? Based on the historical data, the 99.9% daily: