The following equation is the Dividend Discount Model, also known as the 'Gordon Growth Model' or the 'Perpetuity with growth' equation.
### p_{0} = \frac{c_1}{r_{\text{eff}} - g_{\text{eff}}} ###
What is the discount rate '## r_\text{eff} ##' in this equation?
You have $100,000 in the bank. The bank pays interest at 10% pa, given as an effective annual rate.
You wish to consume an equal amount now (t=0) and in one year (t=1) and have nothing left in the bank at the end (t=1).
How much can you consume at each time?
A stock is just about to pay a dividend of $1 tonight. Future annual dividends are expected to grow by 2% pa. The next dividend of $1 will be paid tonight, and the year after that the dividend will be $1.02 (=1*(1+0.02)^1), and a year later 1.0404 (=1*(1+0.04)^2) and so on forever.
Its required total return is 10% pa. The total required return and growth rate of dividends are given as effective annual rates.
Calculate the current stock price.
Total cash flows can be broken into income and capital cash flows.
What is the name given to the cash flow generated from selling shares at a higher price than they were bought?
Question 538 bond pricing, income and capital returns, no explanation
Risk-free government bonds that have coupon rates greater than their yields:
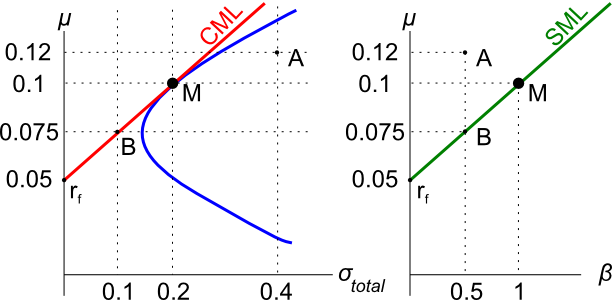
Assets A, B, M and ##r_f## are shown on the graphs above. Asset M is the market portfolio and ##r_f## is the risk free yield on government bonds. Which of the below statements is NOT correct?
Below is a graph of the USD against the JPY and EUR from 1980 to 2015, compiled by the RBA. Select the correct statement about what occurred between 1980 and 2015. Note that in 1980 the euro was around 1.3 USD per EUR and the Yen was around 250 JPY per USD.
Question 889 cross currency interest rate parity, no explanation
Judging by the graph, in 2018 the USD short term interest rate set by the US Federal Reserve is higher than the JPY short term interest rate set by the Bank of Japan, which is higher than the EUR short term interest rate set by the European central bank.
At the latest date shown in 2018: ##r_{USD}>r_{JPY}>r_{EUR}##
Assume that each currency’s yield curve is flat at the latest date shown in 2018, so interest rates are expected to remain at their current level into the future.
Which of the following statements is NOT correct?
Over time you would expect the: