A project's NPV is positive. Select the most correct statement:
Question 207 income and capital returns, bond pricing, coupon rate, no explanation
For a bond that pays fixed semi-annual coupons, how is the annual coupon rate defined, and how is the bond's annual income yield from time 0 to 1 defined mathematically?
Let: ##P_0## be the bond price now,
##F_T## be the bond's face value,
##T## be the bond's maturity in years,
##r_\text{total}## be the bond's total yield,
##r_\text{income}## be the bond's income yield,
##r_\text{capital}## be the bond's capital yield, and
##C_t## be the bond's coupon at time t in years. So ##C_{0.5}## is the coupon in 6 months, ##C_1## is the coupon in 1 year, and so on.
You're considering making an investment in a particular company. They have preference shares, ordinary shares, senior debt and junior debt.
Which is the safest investment? Which has the highest expected returns?
One method for calculating a firm's free cash flow (FFCF, or CFFA) is to ignore interest expense. That is, pretend that interest expense ##(IntExp)## is zero:
###\begin{aligned} FFCF &= (Rev - COGS - Depr - FC - IntExp)(1-t_c) + Depr - CapEx -\Delta NWC + IntExp \\ &= (Rev - COGS - Depr - FC - 0)(1-t_c) + Depr - CapEx -\Delta NWC - 0\\ \end{aligned}###
The below screenshot of Commonwealth Bank of Australia's (CBA) details were taken from the Google Finance website on 7 Nov 2014. Some information has been deliberately blanked out.
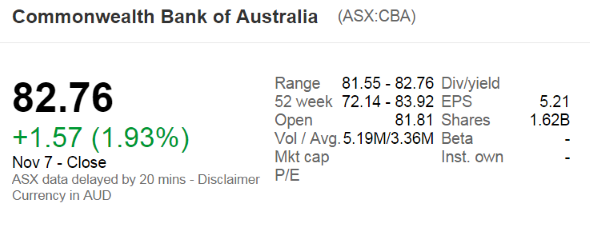
What was CBA's approximate payout ratio over the 2014 financial year?
Note that the firm's interim and final dividends were $1.83 and $2.18 respectively over the 2014 financial year.
Question 531 bankruptcy or insolvency, capital structure, risk, limited liability
Who is most in danger of being personally bankrupt? Assume that all of their businesses' assets are highly liquid and can therefore be sold immediately.
Question 535 DDM, real and nominal returns and cash flows, stock pricing
You are an equities analyst trying to value the equity of the Australian telecoms company Telstra, with ticker TLS. In Australia, listed companies like Telstra tend to pay dividends every 6 months. The payment around August is called the final dividend and the payment around February is called the interim dividend. Both occur annually.
- Today is mid-March 2015.
- TLS's last interim dividend of $0.15 was one month ago in mid-February 2015.
- TLS's last final dividend of $0.15 was seven months ago in mid-August 2014.
Judging by TLS's dividend history and prospects, you estimate that the nominal dividend growth rate will be 1% pa. Assume that TLS's total nominal cost of equity is 6% pa. The dividends are nominal cash flows and the inflation rate is 2.5% pa. All rates are quoted as nominal effective annual rates. Assume that each month is exactly one twelfth (1/12) of a year, so you can ignore the number of days in each month.
Calculate the current TLS share price.
An effective monthly return of 1% ##(r_\text{eff monthly})## is equivalent to an effective annual return ##(r_\text{eff annual})## of:
If a variable, say X, is normally distributed with mean ##\mu## and variance ##\sigma^2## then mathematicians write ##X \sim \mathcal{N}(\mu, \sigma^2)##.
If a variable, say Y, is log-normally distributed and the underlying normal distribution has mean ##\mu## and variance ##\sigma^2## then mathematicians write ## Y \sim \mathbf{ln} \mathcal{N}(\mu, \sigma^2)##.
The below three graphs show probability density functions (PDF) of three different random variables Red, Green and Blue.
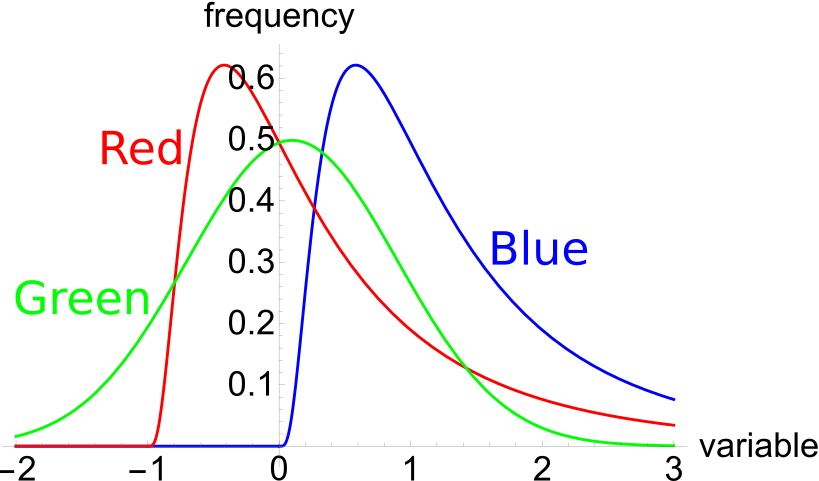
Select the most correct statement: