A stock is expected to pay the following dividends:
| Cash Flows of a Stock | ||||||
| Time (yrs) | 0 | 1 | 2 | 3 | 4 | ... |
| Dividend ($) | 2 | 2 | 2 | 10 | 3 | ... |
After year 4, the dividend will grow in perpetuity at 4% pa. The required return on the stock is 10% pa. Both the growth rate and required return are given as effective annual rates.
What will be the price of the stock in 5 years (t = 5), just after the dividend at that time has been paid?
Find World Bar's Cash Flow From Assets (CFFA), also known as Free Cash Flow to the Firm (FCFF), over the year ending 30th June 2013.
| World Bar | ||
| Income Statement for | ||
| year ending 30th June 2013 | ||
| $m | ||
| Sales | 300 | |
| COGS | 150 | |
| Operating expense | 50 | |
| Depreciation | 40 | |
| Interest expense | 10 | |
| Taxable income | 50 | |
| Tax at 30% | 15 | |
| Net income | 35 | |
| World Bar | ||
| Balance Sheet | ||
| as at 30th June | 2013 | 2012 |
| $m | $m | |
| Assets | ||
| Current assets | 200 | 230 |
| PPE | ||
| Cost | 400 | 400 |
| Accumul. depr. | 75 | 35 |
| Carrying amount | 325 | 365 |
| Total assets | 525 | 595 |
| Liabilities | ||
| Current liabilities | 150 | 205 |
| Non-current liabilities | 235 | 250 |
| Owners' equity | ||
| Retained earnings | 100 | 100 |
| Contributed equity | 40 | 40 |
| Total L and OE | 525 | 595 |
Note: all figures above and below are given in millions of dollars ($m).
Which one of the following is NOT usually considered an 'investable' asset for long-term wealth creation?
One of the reasons why firms may not begin projects with relatively small positive net present values (NPV's) is because they wish to maximise the value of their:
The standard deviation and variance of a stock's annual returns are calculated over a number of years. The units of the returns are percent per annum ##(\% pa)##.
What are the units of the standard deviation ##(\sigma)## and variance ##(\sigma^2)## of returns respectively?
Hint: Visit Wikipedia to understand the difference between percentage points ##(\text{pp})## and percent ##(\%)##.
The standard deviation of monthly changes in the spot price of corn is 50 cents per bushel. The standard deviation of monthly changes in the futures price of corn is 40 cents per bushel. The correlation between the spot price of corn and the futures price of corn is 0.9.
It is now March. A corn chip manufacturer is committed to buying 250,000 bushels of corn in May. The spot price of corn is 381 cents per bushel and the June futures price is 399 cents per bushel.
The corn chip manufacturer wants to use the June corn futures contracts to hedge his risk. Each futures contract is for the delivery of 5,000 bushels of corn. One bushel is about 127 metric tons.
How many corn futures should the corn chip manufacturer buy to hedge his risk? Round your answer to the nearest whole number of contracts. Remember to tail the hedge.
The below three graphs show probability density functions (PDF) of three different random variables Red, Green and Blue.
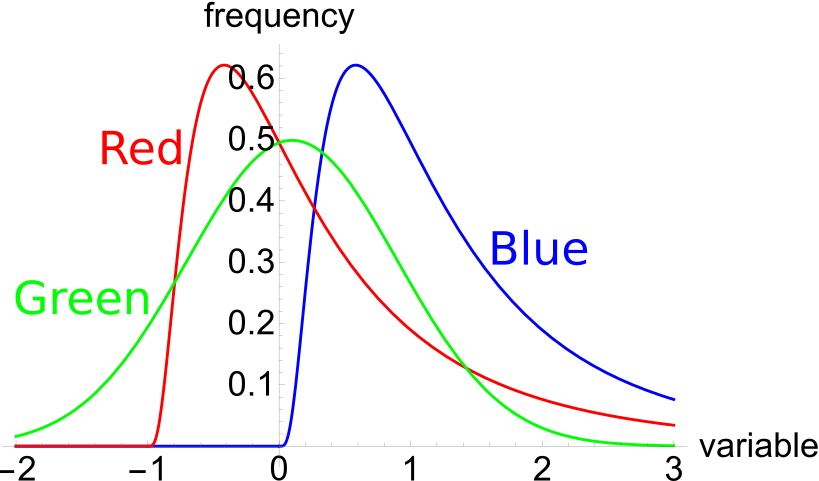
Which of the below statements is NOT correct?
A home loan company advertises an interest rate of 4.5% pa, payable monthly. Which of the following statements about the interest rate is NOT correct?
Question 780 mispriced asset, NPV, DDM, market efficiency, no explanation
A company advertises an investment costing $1,000 which they say is under priced. They say that it has an expected total return of 15% pa, but a required return of only 10% pa. Of the 15% pa total expected return, the dividend yield is expected to be 4% pa and the capital yield 11% pa. Assume that the company's statements are correct.
What is the NPV of buying the investment if the 15% total return lasts for the next 100 years (t=0 to 100), then reverts to 10% after that time? Also, what is the NPV of the investment if the 15% return lasts forever?
In both cases, assume that the required return of 10% remains constant, the dividends can only be re-invested at 10% pa and all returns are given as effective annual rates. The answer choices below are given in the same order (15% for 100 years, and 15% forever):
A stock has an expected return of 10% pa and you're 90% sure that over the next year, the return will be between -15% and 35%. The stock's returns are normally distributed. Note that the Z-statistic corresponding to a one-tail:
- 90% normal probability density function is 1.282.
- 95% normal probability density function is 1.645.
- 97.5% normal probability density function is 1.960.
What is the stock’s standard deviation of returns in percentage points per annum (pp pa)?