A stock is expected to pay the following dividends:
| Cash Flows of a Stock | ||||||
| Time (yrs) | 0 | 1 | 2 | 3 | 4 | ... |
| Dividend ($) | 2 | 2 | 2 | 10 | 3 | ... |
After year 4, the dividend will grow in perpetuity at 4% pa. The required return on the stock is 10% pa. Both the growth rate and required return are given as effective annual rates.
What will be the price of the stock in 5 years (t = 5), just after the dividend at that time has been paid?
Question 249 equivalent annual cash flow, effective rate conversion
Details of two different types of desserts or edible treats are given below:
- High-sugar treats like candy, chocolate and ice cream make a person very happy. High sugar treats are cheap at only $2 per day.
- Low-sugar treats like nuts, cheese and fruit make a person equally happy if these foods are of high quality. Low sugar treats are more expensive at $4 per day.
The advantage of low-sugar treats is that a person only needs to pay the dentist $2,000 for fillings and root canal therapy once every 15 years. Whereas with high-sugar treats, that treatment needs to be done every 5 years.
The real discount rate is 10%, given as an effective annual rate. Assume that there are 365 days in every year and that all cash flows are real. The inflation rate is 3% given as an effective annual rate.
Find the equivalent annual cash flow (EAC) of the high-sugar treats and low-sugar treats, including dental costs. The below choices are listed in that order.
Ignore the pain of dental therapy, personal preferences and other factors.
Question 278 inflation, real and nominal returns and cash flows
Imagine that the interest rate on your savings account was 1% per year and inflation was 2% per year.
In the 1997 Asian financial crisis many countries' exchange rates depreciated rapidly against the US dollar (USD). The Thai, Indonesian, Malaysian, Korean and Filipino currencies were severely affected. The below graph shows these Asian countries' currencies in USD per one unit of their currency, indexed to 100 in June 1997.
Of the statements below, which is NOT correct? The Asian countries':
Which of the following investable assets are NOT suitable for valuation using PE multiples techniques?
A firm has a debt-to-equity ratio of 25%. What is its debt-to-assets ratio?
An Indonesian lady wishes to convert 1 million Indonesian rupiah (IDR) to Australian dollars (AUD). Exchange rates are 13,125 IDR per USD and 0.79 USD per AUD. How many AUD is the IDR 1 million worth?
Question 667 forward foreign exchange rate, foreign exchange rate, cross currency interest rate parity, no explanation
The Australian cash rate is expected to be 2% pa over the next one year, while the US cash rate is expected to be 0% pa, both given as nominal effective annual rates. The current exchange rate is 0.73 USD per AUD.
What is the implied 1 year USD per AUD forward foreign exchange rate?
Question 778 CML, systematic and idiosyncratic risk, portfolio risk, CAPM
The capital market line (CML) is shown in the graph below. The total standard deviation is denoted by σ and the expected return is μ. Assume that markets are efficient so all assets are fairly priced.
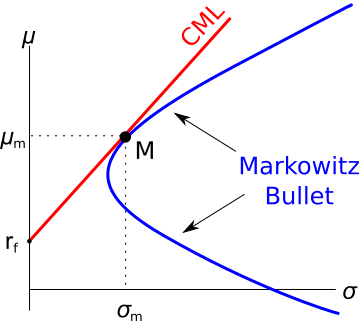
Which of the below statements is NOT correct?
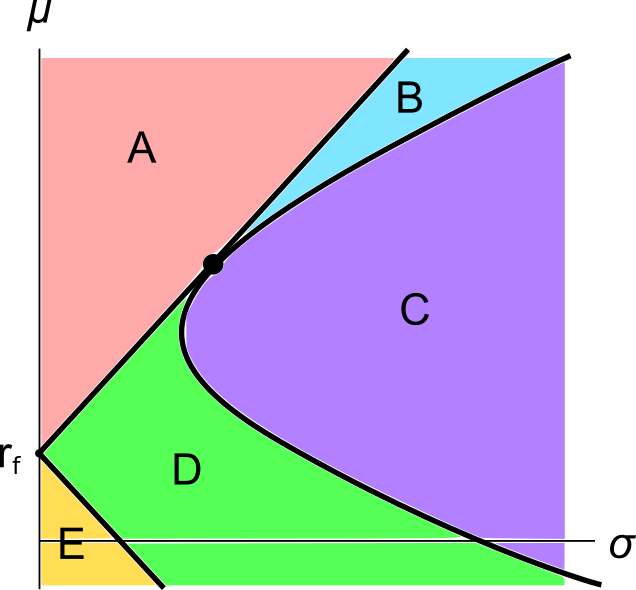
A graph of assets’ expected returns ##(\mu)## versus standard deviations ##(\sigma)## is given in the below diagram.
Each letter corresponds to a separate coloured area. The portfolios at the boundary of the areas, on the black lines, are excluded from each area. Assume that all assets represented in this graph are fairly priced, and that all risky assets can be short-sold.
Which of the following statements about this graph and Markowitz portfolio theory is NOT correct?