A firm wishes to raise $8 million now. They will issue 7% pa semi-annual coupon bonds that will mature in 10 years and have a face value of $100 each. Bond yields are 10% pa, given as an APR compounding every 6 months, and the yield curve is flat.
How many bonds should the firm issue?
A stock has a beta of 0.5. Its next dividend is expected to be $3, paid one year from now. Dividends are expected to be paid annually and grow by 2% pa forever. Treasury bonds yield 5% pa and the market portfolio's expected return is 10% pa. All returns are effective annual rates.
What is the price of the stock now?
Question 339 bond pricing, inflation, market efficiency, income and capital returns
Economic statistics released this morning were a surprise: they show a strong chance of consumer price inflation (CPI) reaching 5% pa over the next 2 years.
This is much higher than the previous forecast of 3% pa.
A vanilla fixed-coupon 2-year risk-free government bond was issued at par this morning, just before the economic news was released.
What is the expected change in bond price after the economic news this morning, and in the next 2 years? Assume that:
- Inflation remains at 5% over the next 2 years.
- Investors demand a constant real bond yield.
- The bond price falls by the (after-tax) value of the coupon the night before the ex-coupon date, as in real life.
The below screenshot of Commonwealth Bank of Australia's (CBA) details were taken from the Google Finance website on 7 Nov 2014. Some information has been deliberately blanked out.
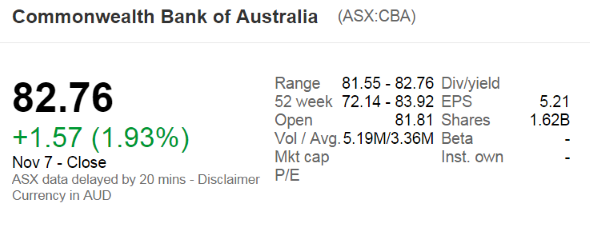
What was CBA's approximate payout ratio over the 2014 financial year?
Note that the firm's interim and final dividends were $1.83 and $2.18 respectively over the 2014 financial year.
The famous investor Warren Buffett is one of few portfolio managers who appears to have consistently beaten the market. His company Berkshire Hathaway (BRK) appears to have outperformed the US S&P500 market index, shown in the graph below.
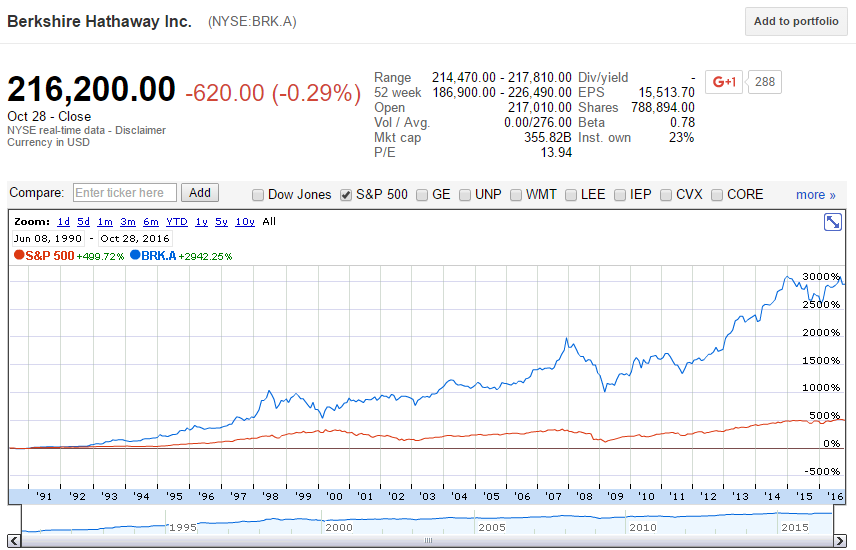
Read the below statements about Warren Buffett and the implications for the Efficient Markets Hypothesis (EMH) theory of Eugene Fama. Assume that the first sentence is true. Analyse the second sentence and select the answer option which is NOT correct. In other words, find the false statement in the second sentence.
Which Australian institution is in charge of monetary policy?
Examine the graph of the AUD versus the USD, EUR and JPY. Note that RHS means right hand side and LHS left hand side which indicates which axis each line corresponds to. Assume inflation rates in each country were equal over the time period 1984 to 2018.
Which of the following statements is NOT correct?
Question 899 comparative advantage in trade, production possibilities curve, no explanation
Adam and Bella are the only people on a remote island. Their production possibility curves are shown in the graph.
Assume that Adam and Bella cooperate according to the principle of comparative advantage.
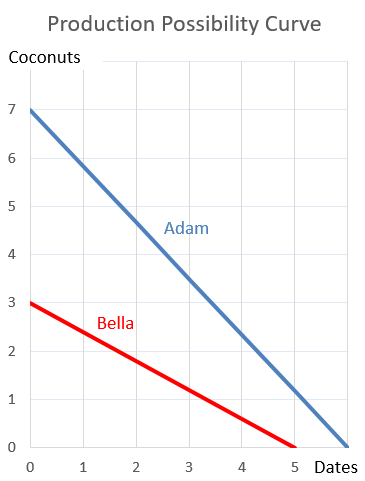
Which of the following statements is NOT correct?
Question 925 mean and median returns, return distribution, arithmetic and geometric averages, continuously compounding rate, no explanation
The arithmetic average and standard deviation of returns on the ASX200 accumulation index over the 24 years from 31 Dec 1992 to 31 Dec 2016 were calculated as follows:
###\bar{r}_\text{yearly} = \dfrac{ \displaystyle\sum\limits_{t=1992}^{24}{\left( \ln \left( \dfrac{P_{t+1}}{P_t} \right) \right)} }{T} = \text{AALGDR} =0.0949=9.49\% \text{ pa}###
###\sigma_\text{yearly} = \dfrac{ \displaystyle\sum\limits_{t=1992}^{24}{\left( \left( \ln \left( \dfrac{P_{t+1}}{P_t} \right) - \bar{r}_\text{yearly} \right)^2 \right)} }{T} = \text{SDLGDR} = 0.1692=16.92\text{ pp pa}###
Assume that the log gross discrete returns are normally distributed and that the above estimates are true population statistics, not sample statistics, so there is no standard error in the sample mean or standard deviation estimates. Also assume that the standardised normal Z-statistic corresponding to a one-tail probability of 2.5% is exactly -1.96.
Which of the following statements is NOT correct? If you invested $1m today in the ASX200, then over the next 4 years:
The market's expected total return is 10% pa and the risk free rate is 5% pa, both given as effective annual rates.
A stock has a beta of 0.7.
In the last 5 minutes, bad economic news was released showing a higher chance of recession. Over this time the share market fell by 2%. The risk free rate was unchanged. What do you think was the stock's historical return over the last 5 minutes, given as an effective 5 minute rate?