A share pays annual dividends. It just paid a dividend of $2. The growth rate in the dividend is 3% pa. You estimate that the stock's required return is 8% pa. Both the discount rate and growth rate are given as effective annual rates.
Using the dividend discount model, what is the share price?
Find World Bar's Cash Flow From Assets (CFFA), also known as Free Cash Flow to the Firm (FCFF), over the year ending 30th June 2013.
| World Bar | ||
| Income Statement for | ||
| year ending 30th June 2013 | ||
| $m | ||
| Sales | 300 | |
| COGS | 150 | |
| Operating expense | 50 | |
| Depreciation | 40 | |
| Interest expense | 10 | |
| Taxable income | 50 | |
| Tax at 30% | 15 | |
| Net income | 35 | |
| World Bar | ||
| Balance Sheet | ||
| as at 30th June | 2013 | 2012 |
| $m | $m | |
| Assets | ||
| Current assets | 200 | 230 |
| PPE | ||
| Cost | 400 | 400 |
| Accumul. depr. | 75 | 35 |
| Carrying amount | 325 | 365 |
| Total assets | 525 | 595 |
| Liabilities | ||
| Current liabilities | 150 | 205 |
| Non-current liabilities | 235 | 250 |
| Owners' equity | ||
| Retained earnings | 100 | 100 |
| Contributed equity | 40 | 40 |
| Total L and OE | 525 | 595 |
Note: all figures above and below are given in millions of dollars ($m).
A 90-day $1 million Bank Accepted Bill (BAB) was bought for $990,000 and sold 30 days later for $996,000 (at t=30 days).
What was the total return, capital return and income return over the 30 days it was held?
Despite the fact that money market instruments such as bills are normally quoted with simple interest rates, please calculate your answers as compound interest rates, specifically, as effective 30-day rates, which is how the below answer choices are listed.
##r_\text{total}##, ##r_\text{capital}##, ## r_\text{income}##
The following table shows a sample of historical total returns of shares in two different companies A and B.
| Stock Returns | ||
| Total effective annual returns | ||
| Year | ##r_A## | ##r_B## |
| 2007 | 0.2 | 0.4 |
| 2008 | 0.04 | -0.2 |
| 2009 | -0.1 | -0.3 |
| 2010 | 0.18 | 0.5 |
What is the historical sample covariance (##\hat{\sigma}_{A,B}##) and correlation (##\rho_{A,B}##) of stock A and B's total effective annual returns?
The below screenshot of Commonwealth Bank of Australia's (CBA) details were taken from the Google Finance website on 7 Nov 2014. Some information has been deliberately blanked out.
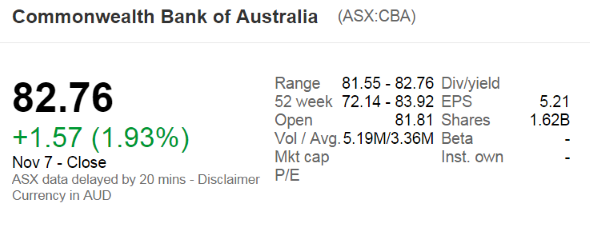
What was CBA's market capitalisation of equity?
Question 606 foreign exchange rate, American and European terms
Which of the following FX quotes (current in October 2015) is given in American terms?
Question 923 omitted variable bias, CAPM, single factor model, single index model, no explanation
Capital Asset Pricing Model (CAPM) and the Single Index Model (SIM) are single factor models whose only risk factor is the market portfolio’s return. Say a Taxi company and an Umbrella company are influenced by two factors, the market portfolio return and rainfall. When it rains, both the Taxi and Umbrella companies’ stock prices do well. When there’s no rain, both do poorly. Assume that rainfall risk is a systematic risk that cannot be diversified and that rainfall has zero correlation with the market portfolio’s returns.
Which of the following statements about these two stocks is NOT correct?
The CAPM and SIM:
You work for XYZ company and you’ve been asked to evaluate a new project which has double the systematic risk of the company’s other projects.
You use the Capital Asset Pricing Model (CAPM) formula and input the treasury yield ##(r_f )##, market risk premium ##(r_m-r_f )## and the company’s asset beta risk factor ##(\beta_{XYZ} )## into the CAPM formula which outputs a return.
This return that you’ve just found is:
Find the Macaulay duration of a 2 year 5% pa annual fixed coupon bond which has a $100 face value and currently has a yield to maturity of 8% pa. The Macaulay duration is: