A share pays annual dividends. It just paid a dividend of $2. The growth rate in the dividend is 3% pa. You estimate that the stock's required return is 8% pa. Both the discount rate and growth rate are given as effective annual rates.
Using the dividend discount model, what is the share price?
When using the dividend discount model, care must be taken to avoid using a nominal dividend growth rate that exceeds the country's nominal GDP growth rate. Otherwise the firm is forecast to take over the country since it grows faster than the average business forever.
Suppose a firm's nominal dividend grows at 10% pa forever, and nominal GDP growth is 5% pa forever. The firm's total dividends are currently $1 billion (t=0). The country's GDP is currently $1,000 billion (t=0).
In approximately how many years will the company's total dividends be as large as the country's GDP?
Question 418 capital budgeting, NPV, interest tax shield, WACC, CFFA, CAPM
| Project Data | ||
| Project life | 1 year | |
| Initial investment in equipment | $8m | |
| Depreciation of equipment per year | $8m | |
| Expected sale price of equipment at end of project | 0 | |
| Unit sales per year | 4m | |
| Sale price per unit | $10 | |
| Variable cost per unit | $5 | |
| Fixed costs per year, paid at the end of each year | $2m | |
| Interest expense in first year (at t=1) | $0.562m | |
| Corporate tax rate | 30% | |
| Government treasury bond yield | 5% | |
| Bank loan debt yield | 9% | |
| Market portfolio return | 10% | |
| Covariance of levered equity returns with market | 0.32 | |
| Variance of market portfolio returns | 0.16 | |
| Firm's and project's debt-to-equity ratio | 50% | |
Notes
- Due to the project, current assets will increase by $6m now (t=0) and fall by $6m at the end (t=1). Current liabilities will not be affected.
Assumptions
- The debt-to-equity ratio will be kept constant throughout the life of the project. The amount of interest expense at the end of each period has been correctly calculated to maintain this constant debt-to-equity ratio.
- Millions are represented by 'm'.
- All cash flows occur at the start or end of the year as appropriate, not in the middle or throughout the year.
- All rates and cash flows are real. The inflation rate is 2% pa. All rates are given as effective annual rates.
- The project is undertaken by a firm, not an individual.
What is the net present value (NPV) of the project?
Question 446 working capital decision, corporate financial decision theory
The working capital decision primarily affects which part of a business?
The below screenshot of Microsoft's (MSFT) details were taken from the Google Finance website on 28 Nov 2014. Some information has been deliberately blanked out.
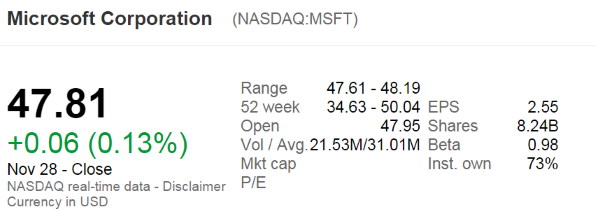
What was MSFT's market capitalisation of equity?
An equity index is currently at 5,200 points. The 6 month futures price is 5,300 points and the total required return is 6% pa with continuous compounding. Each index point is worth $25.
What is the implied dividend yield as a continuously compounded rate per annum?
Which of the following statements about call options is NOT correct?
Question 710 continuously compounding rate, continuously compounding rate conversion
A continuously compounded monthly return of 1% ##(r_\text{cc monthly})## is equivalent to a continuously compounded annual return ##(r_\text{cc annual})## of:
A home loan company advertises an interest rate of 4.5% pa, payable monthly. Which of the following statements about the interest rate is NOT correct?
Question 809 Markowitz portfolio theory, CAPM, Jensens alpha, CML, systematic and idiosyncratic risk
A graph of assets’ expected returns ##(\mu)## versus standard deviations ##(\sigma)## is given in the graph below. The CML is the capital market line.
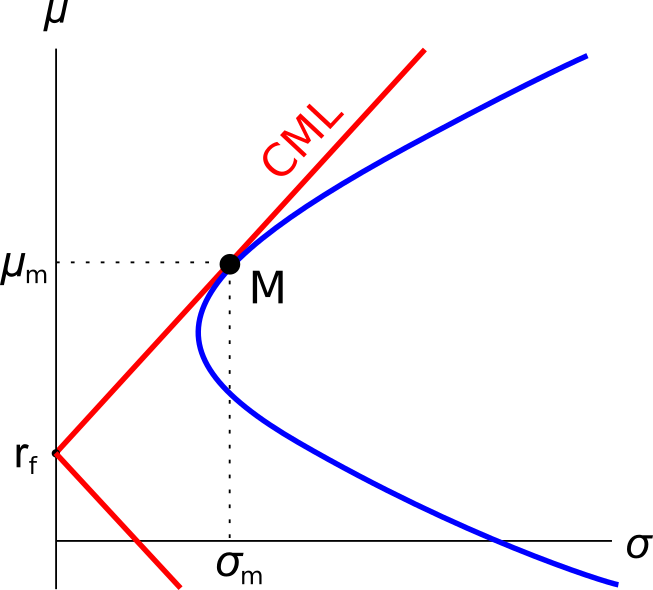
Which of the following statements about this graph, Markowitz portfolio theory and the Capital Asset Pricing Model (CAPM) theory is NOT correct?