Find Piano Bar's Cash Flow From Assets (CFFA), also known as Free Cash Flow to the Firm (FCFF), over the year ending 30th June 2013.
| Piano Bar | ||
| Income Statement for | ||
| year ending 30th June 2013 | ||
| $m | ||
| Sales | 310 | |
| COGS | 185 | |
| Operating expense | 20 | |
| Depreciation | 15 | |
| Interest expense | 10 | |
| Income before tax | 80 | |
| Tax at 30% | 24 | |
| Net income | 56 | |
| Piano Bar | ||
| Balance Sheet | ||
| as at 30th June | 2013 | 2012 |
| $m | $m | |
| Assets | ||
| Current assets | 240 | 230 |
| PPE | ||
| Cost | 420 | 400 |
| Accumul. depr. | 50 | 35 |
| Carrying amount | 370 | 365 |
| Total assets | 610 | 595 |
| Liabilities | ||
| Current liabilities | 180 | 190 |
| Non-current liabilities | 290 | 265 |
| Owners' equity | ||
| Retained earnings | 90 | 90 |
| Contributed equity | 50 | 50 |
| Total L and OE | 610 | 595 |
Note: all figures are given in millions of dollars ($m).
In the dividend discount model:
###P_0 = \dfrac{C_1}{r-g}###
The return ##r## is supposed to be the:
Question 708 continuously compounding rate, continuously compounding rate conversion
Convert a 10% continuously compounded annual rate ##(r_\text{cc annual})## into an effective annual rate ##(r_\text{eff annual})##. The equivalent effective annual rate is:
A firm wishes to raise $50 million now. They will issue 5% pa semi-annual coupon bonds that will mature in 10 years and have a face value of $100 each. Bond yields are 5% pa, given as an APR compounding every 6 months, and the yield curve is flat.
How many bonds should the firm issue?
A firm wishes to raise $30 million now. The firm's current market value of equity is $60m and the market price per share is $20. They estimate that they'll be able to issue shares in a rights issue at a subscription price of $15. Ignore the time value of money and assume that all shareholders exercise their rights. Which of the following statements is NOT correct?
Question 791 mean and median returns, return distribution, arithmetic and geometric averages, continuously compounding rate, log-normal distribution, VaR, confidence interval
A risk manager has identified that their pension fund’s continuously compounded portfolio returns are normally distributed with a mean of 5% pa and a standard deviation of 20% pa. The fund’s portfolio is currently valued at $1 million. Assume that there is no estimation error in the above figures. To simplify your calculations, all answers below use 2.33 as an approximation for the normal inverse cumulative density function at 99%. All answers are rounded to the nearest dollar. Which of the following statements is NOT correct?
Question 859 money supply, no explanation
The below table shows Australian monetary aggregates. Note that ‘M3’ is the sum of all the figures in the table and ‘ADI’ stands for Authorised Deposit-taking Institution such as a bank, building society or credit union.
| Australian Monetary Aggregates | ||||||
| March 2017, AUD billions | ||||||
| Currency | Current deposits with banks |
Certificates of deposit issued by banks |
Term deposits with banks |
Other deposits with banks |
Deposits with non-bank ADIs |
M3 |
| 69.3 | 271.6 | 207.2 | 562.3 | 838.7 | 36.9 | 1986.0 |
Source: RBA Statistical Table D3 Monetary Aggregates.
Which of the following statements is NOT correct?
Question 907 continuously compounding rate, return types, return distribution, price gains and returns over time
For an asset's price to double from say $1 to $2 in one year, what must its continuously compounded return ##(r_{CC})## be? If the price now is ##P_0## and the price in one year is ##P_1## then the continuously compounded return over the next year is:
###r_\text{CC annual} = \ln{\left[ \dfrac{P_1}{P_0} \right]} = \text{LGDR}_\text{annual}###By convention, money market securities' yields are always quoted as:
Question 977 comparative advantage in trade, production possibilities curve, no explanation
Arthur and Bindi are the only people on a remote island. Their production possibility curves are shown in the graph.
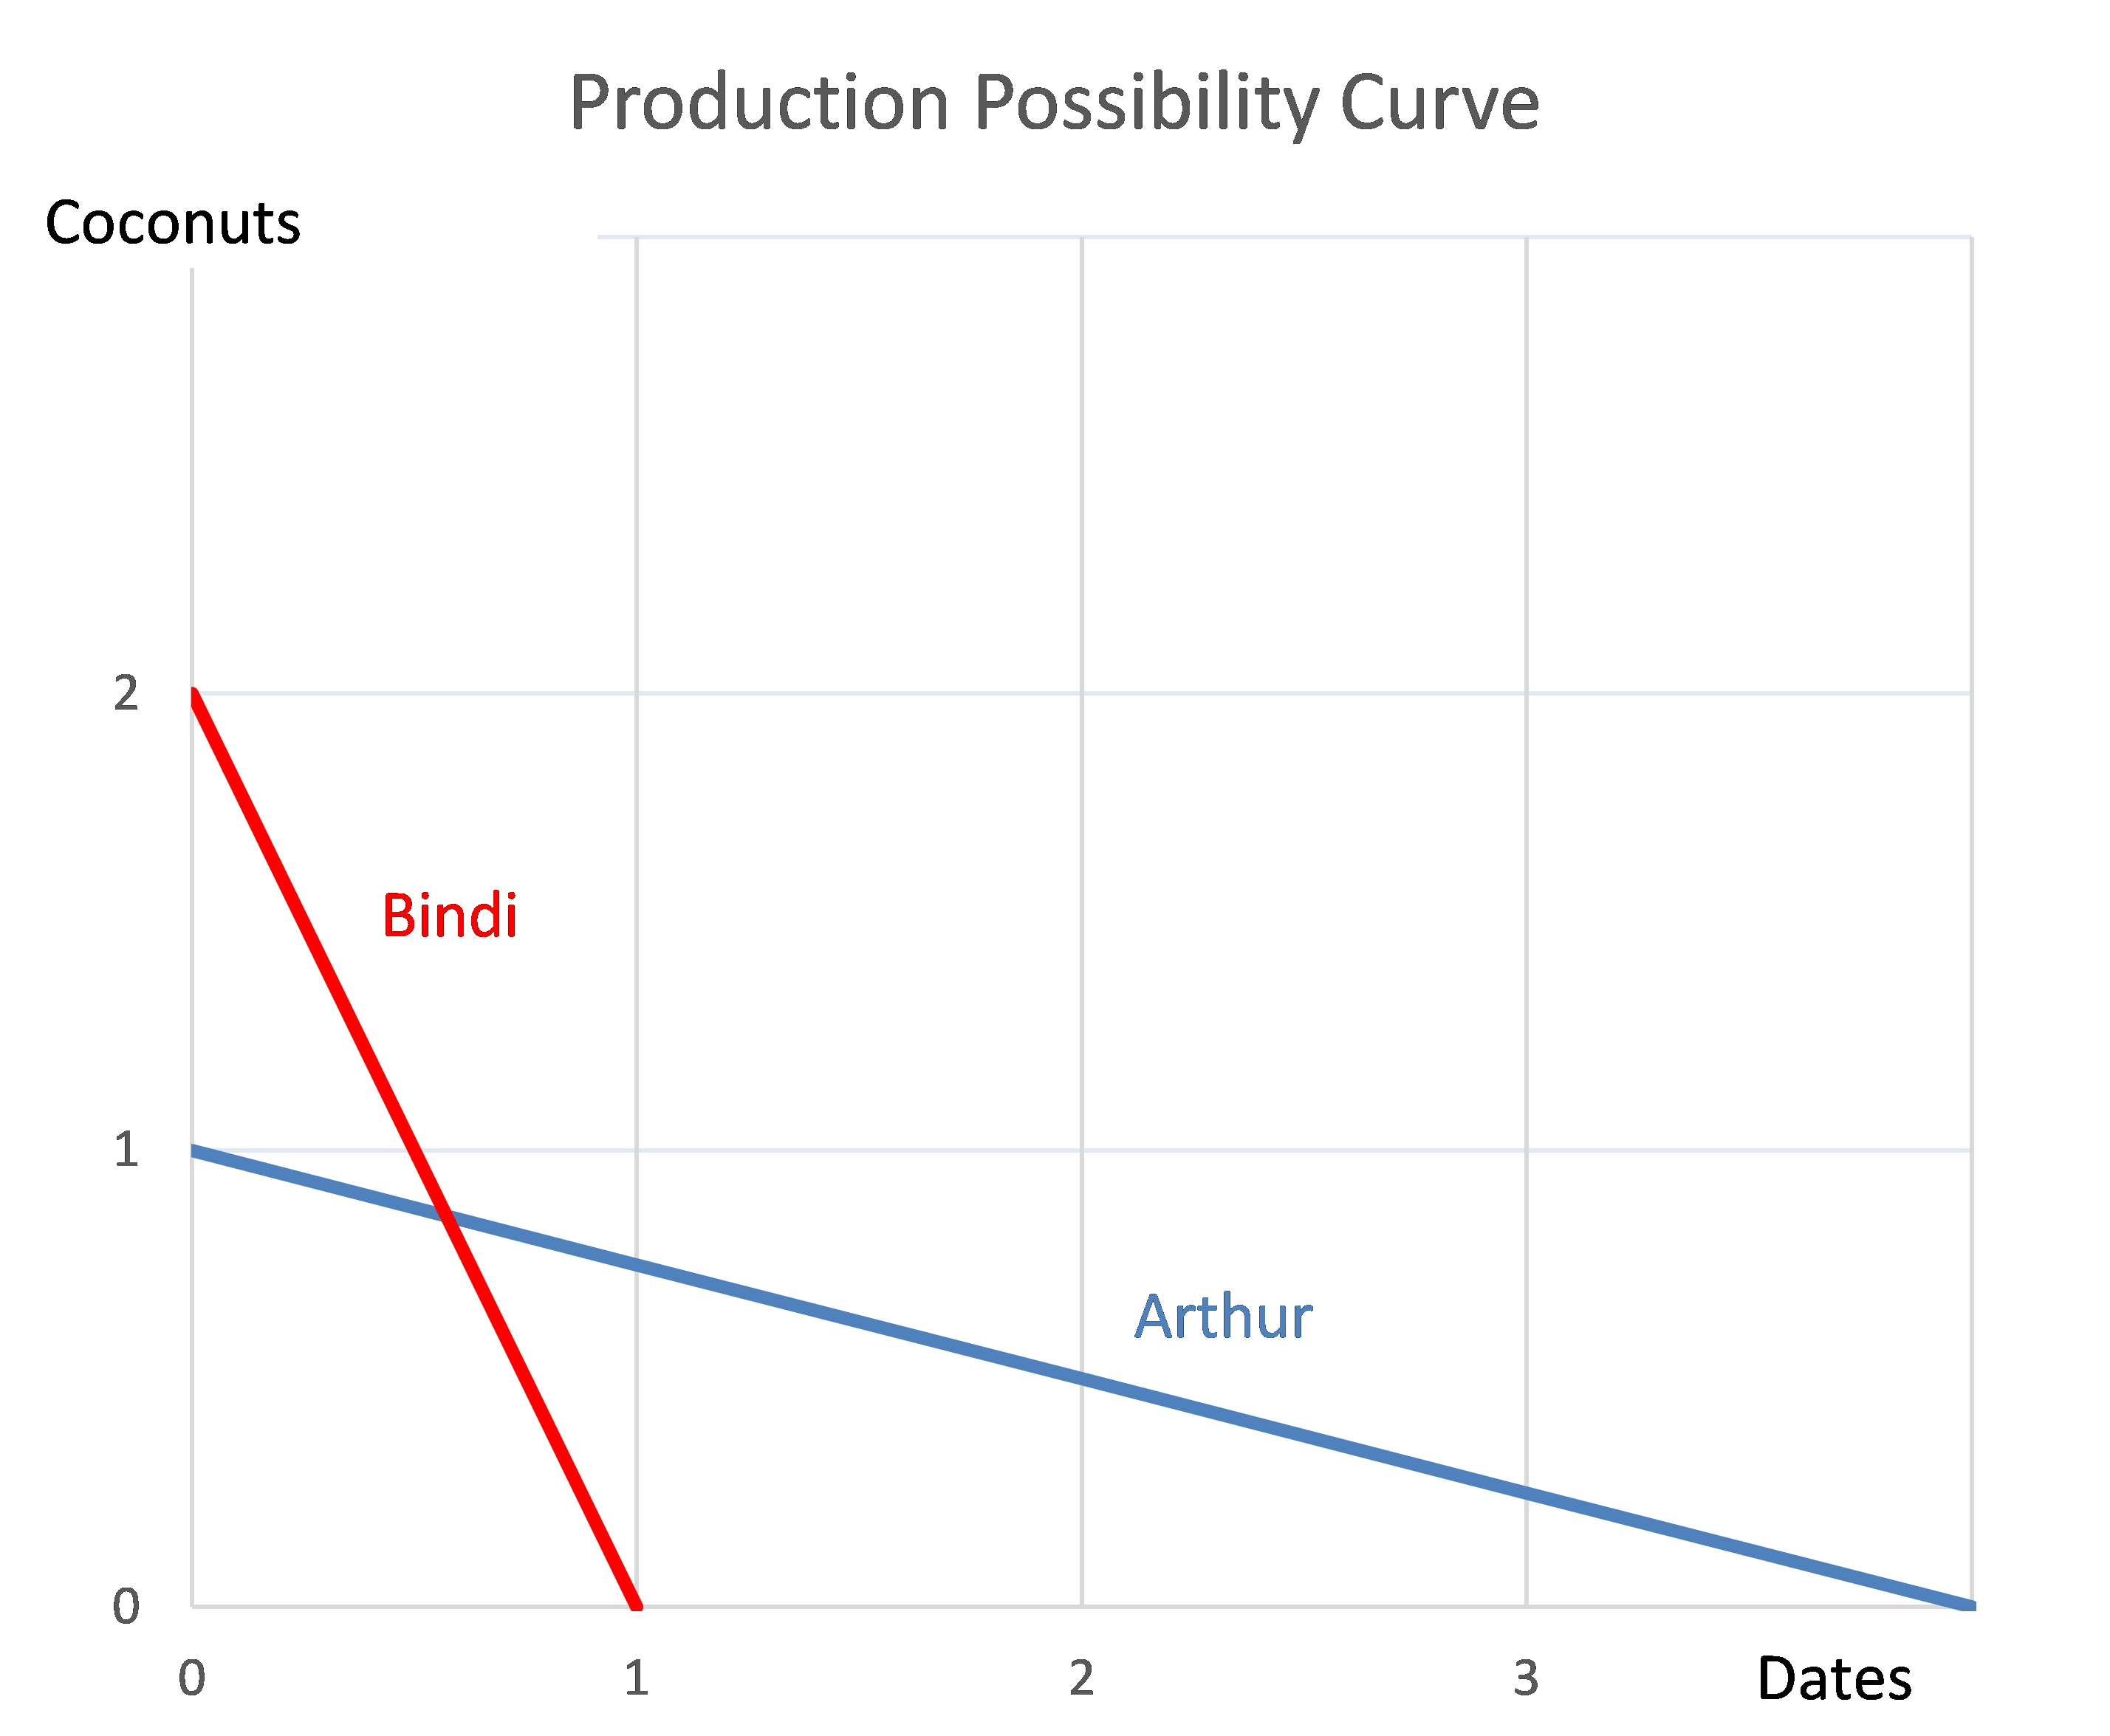
Which of the following statements is NOT correct?