Question 22 NPV, perpetuity with growth, effective rate, effective rate conversion
What is the NPV of the following series of cash flows when the discount rate is 10% given as an effective annual rate?
The first payment of $90 is in 3 years, followed by payments every 6 months in perpetuity after that which shrink by 3% every 6 months. That is, the growth rate every 6 months is actually negative 3%, given as an effective 6 month rate. So the payment at ## t=3.5 ## years will be ## 90(1-0.03)^1=87.3 ##, and so on.
Your neighbour asks you for a loan of $100 and offers to pay you back $120 in one year.
You don't actually have any money right now, but you can borrow and lend from the bank at a rate of 10% pa. Rates are given as effective annual rates.
Assume that your neighbour will definitely pay you back. Ignore interest tax shields and transaction costs.
The Net Present Value (NPV) of lending to your neighbour is $9.09. Describe what you would do to actually receive a $9.09 cash flow right now with zero net cash flows in the future.
Question 416 real estate, market efficiency, income and capital returns, DDM, CAPM
A residential real estate investor believes that house prices will grow at a rate of 5% pa and that rents will grow by 2% pa forever.
All rates are given as nominal effective annual returns. Assume that:
- His forecast is true.
- Real estate is and always will be fairly priced and the capital asset pricing model (CAPM) is true.
- Ignore all costs such as taxes, agent fees, maintenance and so on.
- All rental income cash flow is paid out to the owner, so there is no re-investment and therefore no additions or improvements made to the property.
- The non-monetary benefits of owning real estate and renting remain constant.
Which one of the following statements is NOT correct? Over time:
The below screenshot of Microsoft's (MSFT) details were taken from the Google Finance website on 28 Nov 2014. Some information has been deliberately blanked out.
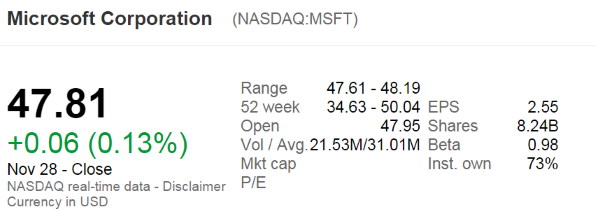
What was MSFT's backwards-looking price-earnings ratio?
Question 579 price gains and returns over time, time calculation, effective rate
How many years will it take for an asset's price to double if the price grows by 10% pa?
"Buy low, sell high" is a phrase commonly heard in financial markets. It states that traders should try to buy assets at low prices and sell at high prices.
Traders in the fixed-coupon bond markets often quote promised bond yields rather than prices. Fixed-coupon bond traders should try to:
Question 925 mean and median returns, return distribution, arithmetic and geometric averages, continuously compounding rate, no explanation
The arithmetic average and standard deviation of returns on the ASX200 accumulation index over the 24 years from 31 Dec 1992 to 31 Dec 2016 were calculated as follows:
###\bar{r}_\text{yearly} = \dfrac{ \displaystyle\sum\limits_{t=1992}^{24}{\left( \ln \left( \dfrac{P_{t+1}}{P_t} \right) \right)} }{T} = \text{AALGDR} =0.0949=9.49\% \text{ pa}###
###\sigma_\text{yearly} = \dfrac{ \displaystyle\sum\limits_{t=1992}^{24}{\left( \left( \ln \left( \dfrac{P_{t+1}}{P_t} \right) - \bar{r}_\text{yearly} \right)^2 \right)} }{T} = \text{SDLGDR} = 0.1692=16.92\text{ pp pa}###
Assume that the log gross discrete returns are normally distributed and that the above estimates are true population statistics, not sample statistics, so there is no standard error in the sample mean or standard deviation estimates. Also assume that the standardised normal Z-statistic corresponding to a one-tail probability of 2.5% is exactly -1.96.
Which of the following statements is NOT correct? If you invested $1m today in the ASX200, then over the next 4 years:
Question 963 Bretton Woods, foreign exchange rate, foreign exchange system history, no explanation
Under the Bretton Woods System (1944 to 1971), currencies were priced relative to:
A Malaysian man wishes to convert 1 million Malaysian Ringgit (MYR) into Indian Rupees (IND). The exchange rate is 4.2 MYR per USD and 71 IND per USD. How much is the MYR 1 million worth in IND?
Question 988 variance, covariance, beta, CAPM, risk, no explanation
| Price Data Time Series | |||||||||||
| Sourced from Yahoo Finance Historical Price Data | |||||||||||
| Date | S&P500 Index (^GSPC) | Apple (AAPL) | |||||||||
| Open | High | Low | Close | Adj close | Open | High | Low | Close | Adj close | ||
| 2007, Wed 3 Jan | 1418 | 1429 | 1408 | 1417 | 1417 | 12.33 | 12.37 | 11.7 | 11.97 | 10.42 | |
| 2008, Wed 2 Jan | 1468 | 1472 | 1442 | 1447 | 1447 | 28.47 | 28.61 | 27.51 | 27.83 | 24.22 | |
| 2009, Fri 2 Jan | 903 | 935 | 899 | 932 | 932 | 12.27 | 13.01 | 12.17 | 12.96 | 11.28 | |
| 2010, Mon 4 Jan | 1117 | 1134 | 1117 | 1133 | 1133 | 30.49 | 30.64 | 30.34 | 30.57 | 26.6 | |
| Source: Yahoo Finance. | |||||||||||
Which of the following statements about the above table which is used to calculate Apple's equity beta is NOT correct?