Which one of the following will increase the Cash Flow From Assets in this year for a tax-paying firm, all else remaining constant?
A 10 year bond has a face value of $100, a yield of 6% pa and a fixed coupon rate of 8% pa, paid semi-annually. What is its price?
Estimate Microsoft's (MSFT) share price using a price earnings (PE) multiples approach with the following assumptions and figures only:
- Apple, Google and Microsoft are comparable companies,
- Apple's (AAPL) share price is $526.24 and historical EPS is $40.32.
- Google's (GOOG) share price is $1,215.65 and historical EPS is $36.23.
- Micrsoft's (MSFT) historical earnings per share (EPS) is $2.71.
Source: Google Finance 28 Feb 2014.
Question 386 Merton model of corporate debt, real option, option
A risky firm will last for one period only (t=0 to 1), then it will be liquidated. So it's assets will be sold and the debt holders and equity holders will be paid out in that order. The firm has the following quantities:
##V## = Market value of assets.
##E## = Market value of (levered) equity.
##D## = Market value of zero coupon bonds.
##F_1## = Total face value of zero coupon bonds which is promised to be paid in one year.
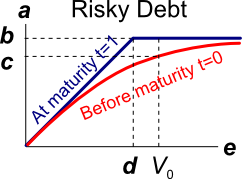
The risky corporate debt graph above contains bold labels a to e. Which of the following statements about those labels is NOT correct?
In Australia in the 1980's, inflation was around 8% pa, and residential mortgage loan interest rates were around 14%.
In 2013, inflation was around 2.5% pa, and residential mortgage loan interest rates were around 4.5%.
If a person can afford constant mortgage loan payments of $2,000 per month, how much more can they borrow when interest rates are 4.5% pa compared with 14.0% pa?
Give your answer as a proportional increase over the amount you could borrow when interest rates were high ##(V_\text{high rates})##, so:
###\text{Proportional increase} = \dfrac{V_\text{low rates}-V_\text{high rates}}{V_\text{high rates}} ###
Assume that:
- Interest rates are expected to be constant over the life of the loan.
- Loans are interest-only and have a life of 30 years.
- Mortgage loan payments are made every month in arrears and all interest rates are given as annualised percentage rates (APR's) compounding per month.
Question 523 income and capital returns, real and nominal returns and cash flows, inflation
A low-growth mature stock has an expected nominal total return of 6% pa and nominal capital return of 2% pa. Inflation is expected to be 3% pa.
All of the above are effective nominal rates and investors believe that they will stay the same in perpetuity.
What are the stock's expected real total, capital and income returns?
The answer choices below are given in the same order.
If trader A has sold the right that allows counterparty B to buy the underlying asset from him at maturity if counterparty B wants then trader A is:
Question 904 option, Black-Scholes-Merton option pricing, option on future on stock index
A six month European-style call option on six month S&P500 index futures has a strike price of 2800 points.
The six month futures price on the S&P500 index is currently at 2740.805274 points. The futures underlie the call option.
The S&P500 stock index currently trades at 2700 points. The stock index underlies the futures. The stock index's standard deviation of continuously compounded returns is 25% pa.
The risk-free interest rate is 5% pa continuously compounded.
Use the Black-Scholes-Merton formula to calculate the option price. The call option price now is:
Question 973 foreign exchange rate, monetary policy, no explanation
Suppose the market expects the Reserve Bank of Australia (RBA) to increase the policy rate by 25 basis points at their next meeting. The current exchange rate is 0.8 USD per AUD.
Then unexpectedly, the RBA announce that they will leave the policy rate unchanged due to increasing unemployment and fears of a potential recession.
What do you expect to happen to Australia's exchange rate on the day when the surprise announcement is made? The Australian dollar is likely to:
Question 988 variance, covariance, beta, CAPM, risk, no explanation
| Price Data Time Series | |||||||||||
| Sourced from Yahoo Finance Historical Price Data | |||||||||||
| Date | S&P500 Index (^GSPC) | Apple (AAPL) | |||||||||
| Open | High | Low | Close | Adj close | Open | High | Low | Close | Adj close | ||
| 2007, Wed 3 Jan | 1418 | 1429 | 1408 | 1417 | 1417 | 12.33 | 12.37 | 11.7 | 11.97 | 10.42 | |
| 2008, Wed 2 Jan | 1468 | 1472 | 1442 | 1447 | 1447 | 28.47 | 28.61 | 27.51 | 27.83 | 24.22 | |
| 2009, Fri 2 Jan | 903 | 935 | 899 | 932 | 932 | 12.27 | 13.01 | 12.17 | 12.96 | 11.28 | |
| 2010, Mon 4 Jan | 1117 | 1134 | 1117 | 1133 | 1133 | 30.49 | 30.64 | 30.34 | 30.57 | 26.6 | |
| Source: Yahoo Finance. | |||||||||||
Which of the following statements about the above table which is used to calculate Apple's equity beta is NOT correct?