A firm has forecast its Cash Flow From Assets (CFFA) for this year and management is worried that it is too low. Which one of the following actions will lead to a higher CFFA for this year (t=0 to 1)? Only consider cash flows this year. Do not consider cash flows after one year, or the change in the NPV of the firm. Consider each action in isolation.
You own an apartment which you rent out as an investment property.
What is the price of the apartment using discounted cash flow (DCF, same as NPV) valuation?
Assume that:
- You just signed a contract to rent the apartment out to a tenant for the next 12 months at $2,000 per month, payable in advance (at the start of the month, t=0). The tenant is just about to pay you the first $2,000 payment.
- The contract states that monthly rental payments are fixed for 12 months. After the contract ends, you plan to sign another contract but with rental payment increases of 3%. You intend to do this every year.
So rental payments will increase at the start of the 13th month (t=12) to be $2,060 (=2,000(1+0.03)), and then they will be constant for the next 12 months.
Rental payments will increase again at the start of the 25th month (t=24) to be $2,121.80 (=2,000(1+0.03)2), and then they will be constant for the next 12 months until the next year, and so on. - The required return of the apartment is 8.732% pa, given as an effective annual rate.
- Ignore all taxes, maintenance, real estate agent, council and strata fees, periods of vacancy and other costs. Assume that the apartment will last forever and so will the rental payments.
An asset's total expected return over the next year is given by:
###r_\text{total} = \dfrac{c_1+p_1-p_0}{p_0} ###
Where ##p_0## is the current price, ##c_1## is the expected income in one year and ##p_1## is the expected price in one year. The total return can be split into the income return and the capital return.
Which of the following is the expected capital return?
Question 573 bond pricing, zero coupon bond, term structure of interest rates, expectations hypothesis, liquidity premium theory, forward interest rate, yield curve
In the below term structure of interest rates equation, all rates are effective annual yields and the numbers in subscript represent the years that the yields are measured over:
###(1+r_{0-3})^3 = (1+r_{0-1})(1+r_{1-2})(1+r_{2-3}) ###
Which of the following statements is NOT correct?
In February a company sold one December 40,000 pound (about 18 metric tons) lean hog futures contract. It closed out its position in May.
The spot price was $0.68 per pound in February. The December futures price was $0.70 per pound when the trader entered into the contract in February, $0.60 when he closed out his position in May, and $0.55 when the contract matured in December.
What was the total profit?
Question 780 mispriced asset, NPV, DDM, market efficiency, no explanation
A company advertises an investment costing $1,000 which they say is under priced. They say that it has an expected total return of 15% pa, but a required return of only 10% pa. Of the 15% pa total expected return, the dividend yield is expected to be 4% pa and the capital yield 11% pa. Assume that the company's statements are correct.
What is the NPV of buying the investment if the 15% total return lasts for the next 100 years (t=0 to 100), then reverts to 10% after that time? Also, what is the NPV of the investment if the 15% return lasts forever?
In both cases, assume that the required return of 10% remains constant, the dividends can only be re-invested at 10% pa and all returns are given as effective annual rates. The answer choices below are given in the same order (15% for 100 years, and 15% forever):
Question 811 log-normal distribution, mean and median returns, return distribution, arithmetic and geometric averages
Which of the following statements about probability distributions is NOT correct?
Question 948 VaR, expected shortfall
Below is a historical sample of returns on the S&P500 capital index.
| S&P500 Capital Index Daily Returns Ranked from Best to Worst |
||
| 10,000 trading days from 4th August 1977 to 24 March 2017 based on closing prices. |
||
| Rank | Date (DD-MM-YY) |
Continuously compounded daily return (% per day) |
| 1 | 21-10-87 | 9.23 |
| 2 | 08-03-83 | 8.97 |
| 3 | 13-11-08 | 8.3 |
| 4 | 30-09-08 | 8.09 |
| 5 | 28-10-08 | 8.01 |
| 6 | 29-10-87 | 7.28 |
| … | … | … |
| 9980 | 11-12-08 | -5.51 |
| 9981 | 22-10-08 | -5.51 |
| 9982 | 08-08-11 | -5.54 |
| 9983 | 22-09-08 | -5.64 |
| 9984 | 11-09-86 | -5.69 |
| 9985 | 30-11-87 | -5.88 |
| 9986 | 14-04-00 | -5.99 |
| 9987 | 07-10-98 | -6.06 |
| 9988 | 08-01-88 | -6.51 |
| 9989 | 27-10-97 | -6.55 |
| 9990 | 13-10-89 | -6.62 |
| 9991 | 15-10-08 | -6.71 |
| 9992 | 29-09-08 | -6.85 |
| 9993 | 07-10-08 | -6.91 |
| 9994 | 14-11-08 | -7.64 |
| 9995 | 01-12-08 | -7.79 |
| 9996 | 29-10-08 | -8.05 |
| 9997 | 26-10-87 | -8.4 |
| 9998 | 31-08-98 | -8.45 |
| 9999 | 09-10-08 | -12.9 |
| 10000 | 19-10-87 | -23.36 |
| Mean of all 10,000: | 0.0354 | |
| Sample standard deviation of all 10,000: | 1.2062 | |
| Sources: Bloomberg and S&P. | ||
Assume that the one-tail Z-statistic corresponding to a probability of 99.9% is exactly 3.09. Which of the following statements is NOT correct? Based on the historical data, the 99.9% daily:
Question 975 comparative advantage in trade, production possibilities curve, no explanation
Arthur and Bindi are the only people on a remote island.
Luckily there are Coconut and Date palm trees on the island that grow delicious fruit. The problem is that harvesting the fruit takes a lot of work.
Arthur can pick 1 coconut per hour, 4 dates per hour or any linear combination of coconuts and dates. For example, he could pick 0.5 coconuts and 2 dates per hour.
Bindi can pick 2 coconuts per hour, 1 date per hour or any linear combination. For example, she could pick 0.5 coconuts and 0.75 dates per hour.
This information is summarised in the table and graph:
| Harvest Rates Per Hour | ||
| Coconuts | Dates | |
| Arthur | 1 | 4 |
| Bindi | 2 | 1 |
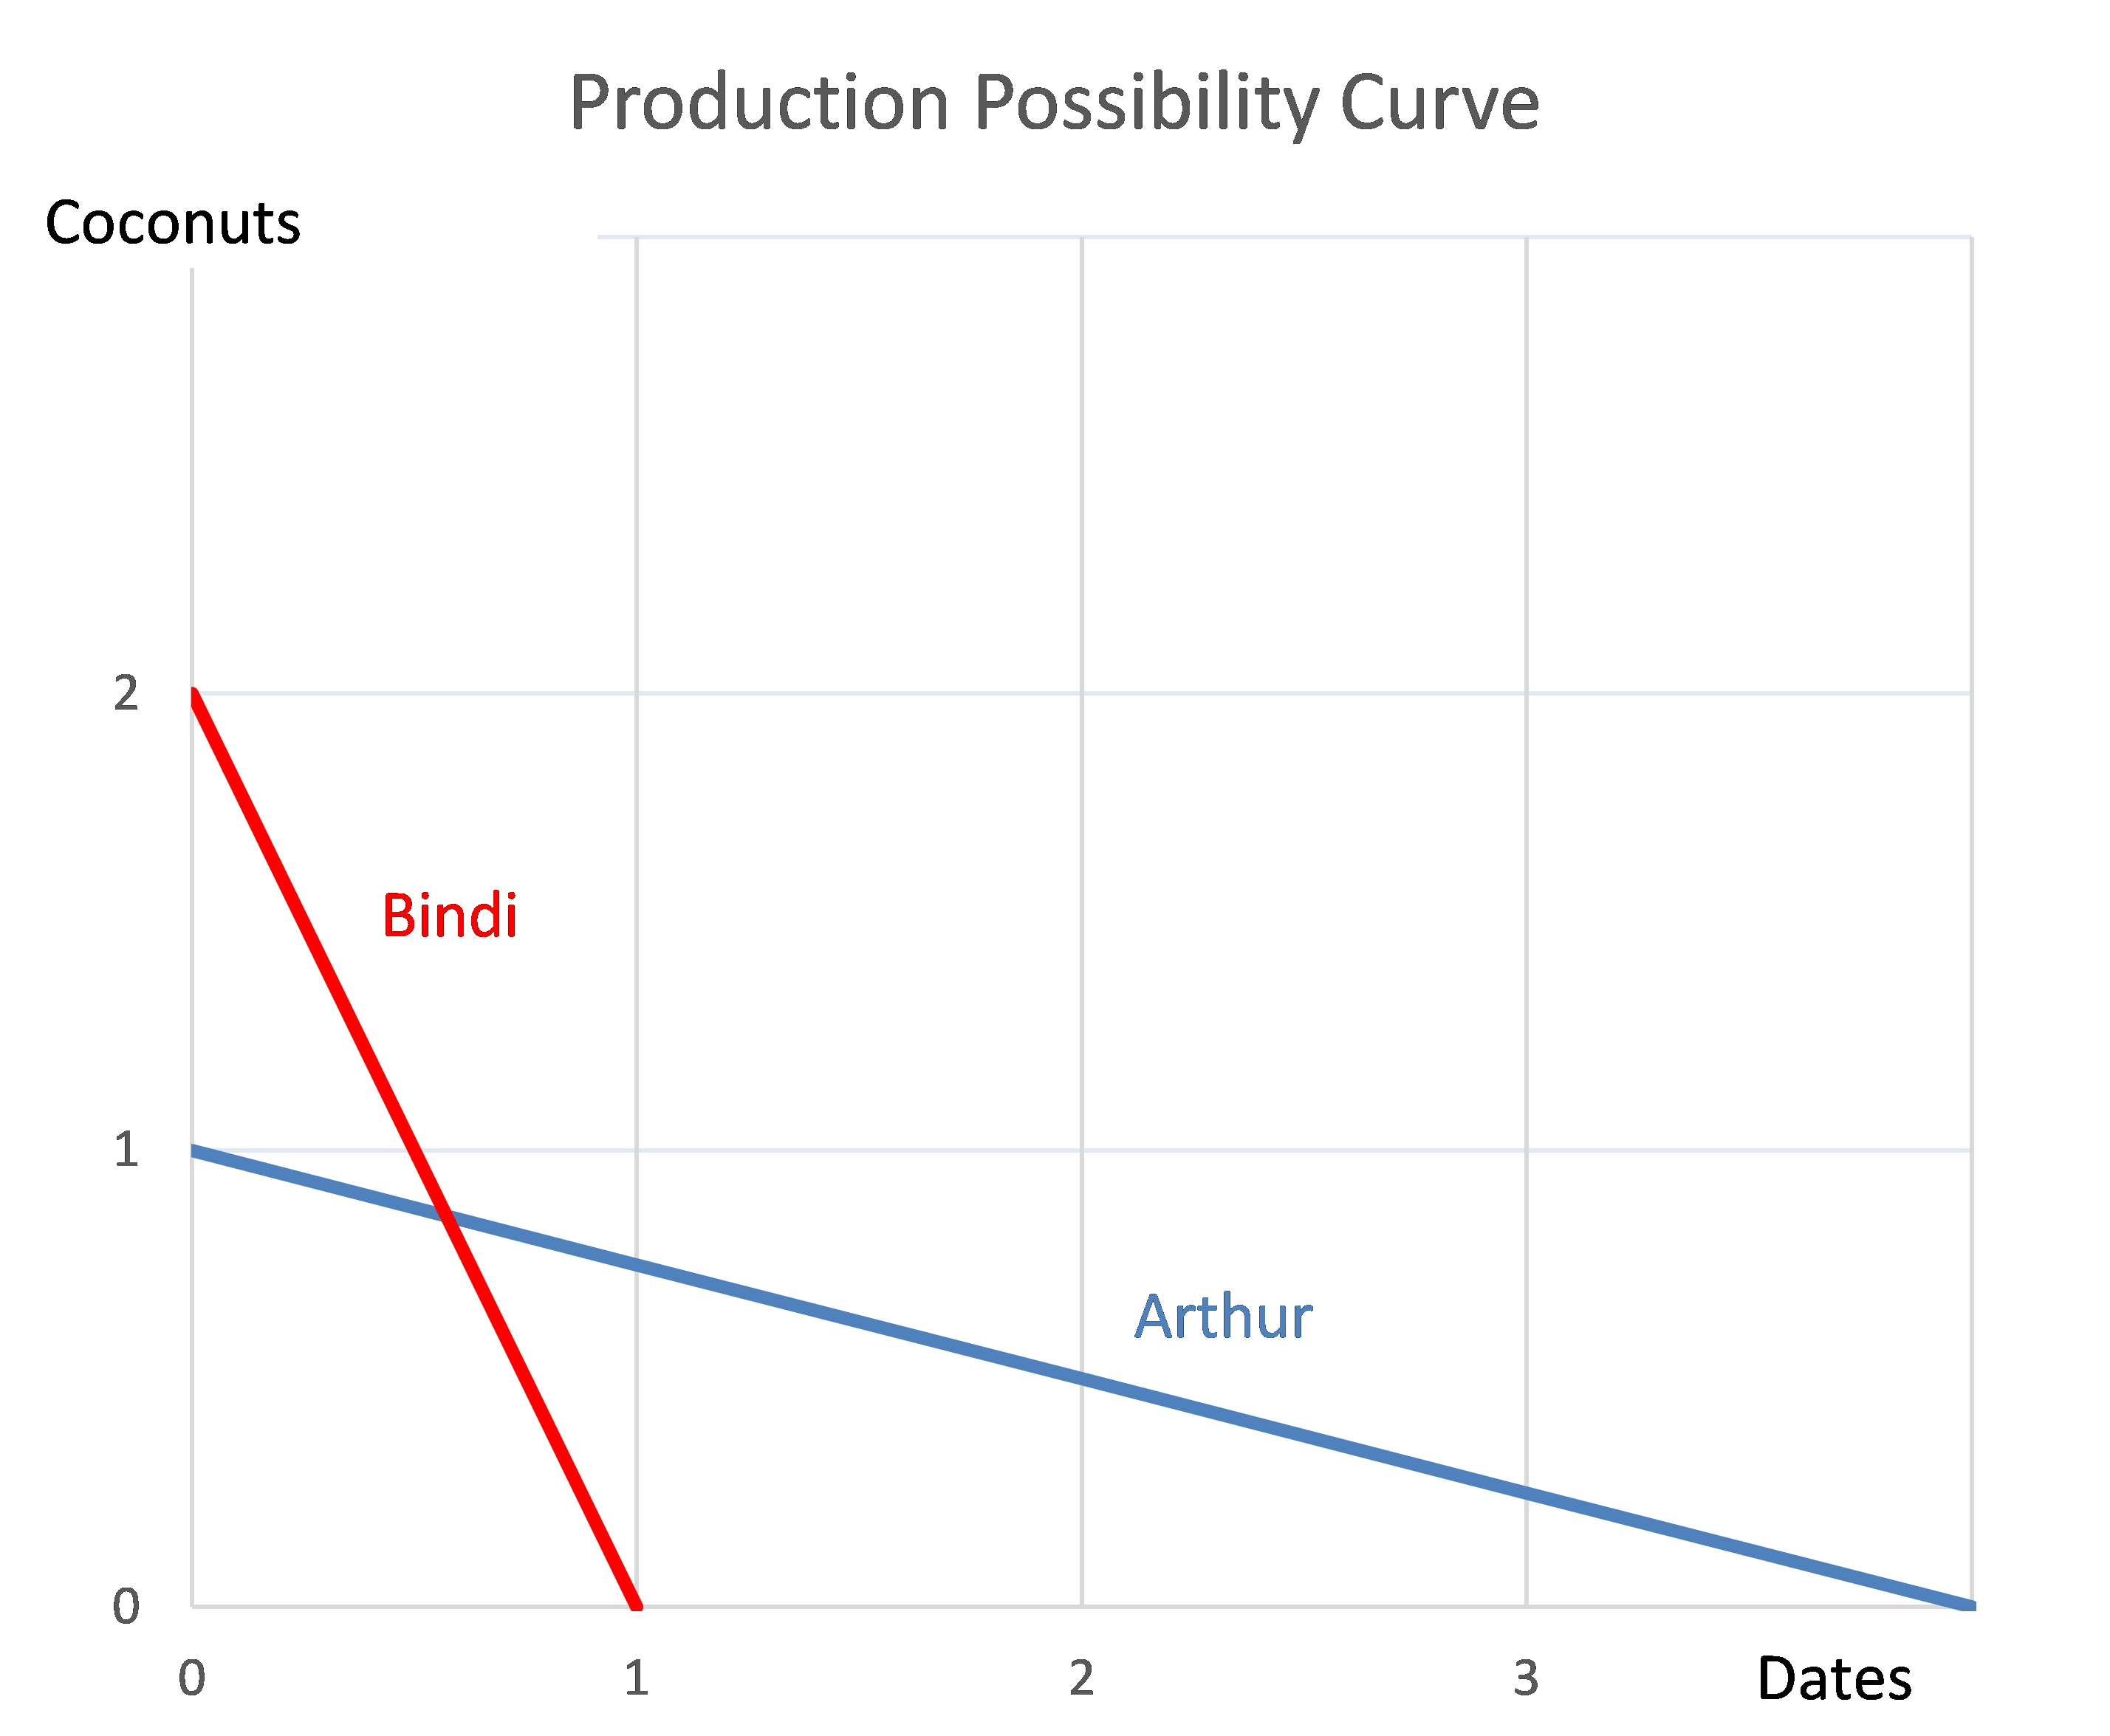
Which of the following statements is NOT correct?
Question 980 balance of payments, current account, no explanation
Observe the below graph of the US current account surplus as a proportion of GDP.
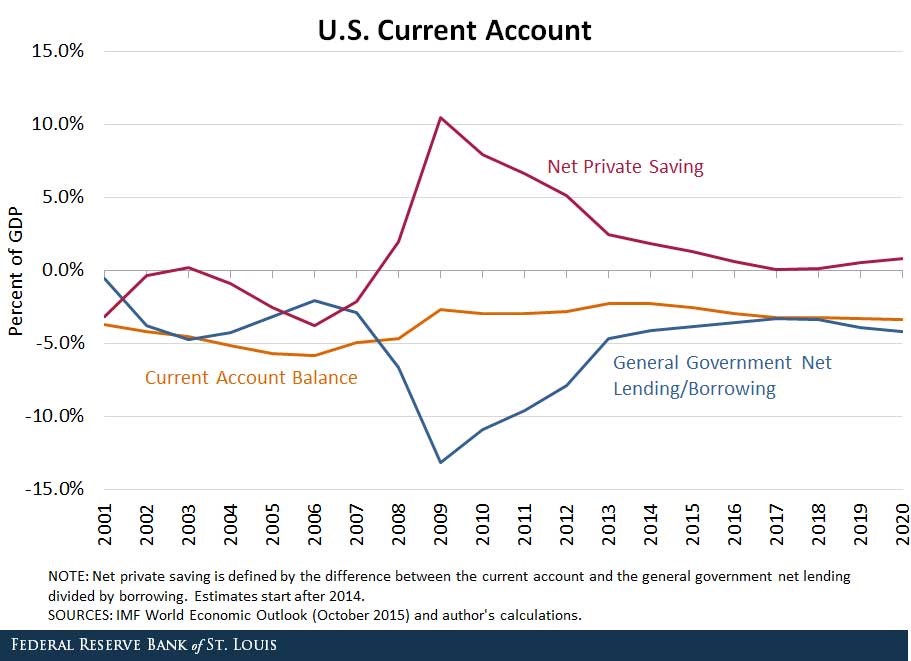
Define lending as buying (or saving or investing in) debt and equity assets.
The sum of US ‘net private saving’ plus ‘net general government lending’ equals the US: