You have $100,000 in the bank. The bank pays interest at 10% pa, given as an effective annual rate.
You wish to consume an equal amount now (t=0) and in one year (t=1) and have nothing left in the bank at the end (t=1).
How much can you consume at each time?
A new company's Firm Free Cash Flow (FFCF, same as CFFA) is forecast in the graph below.
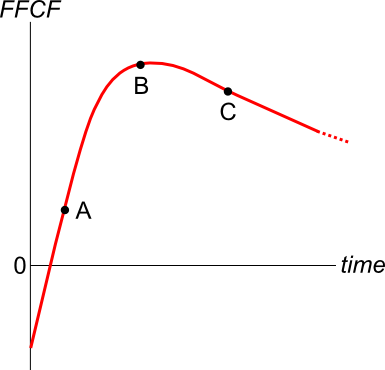
To value the firm's assets, the terminal value needs to be calculated using the perpetuity with growth formula:
###V_{\text{terminal, }t-1} = \dfrac{FFCF_{\text{terminal, }t}}{r-g}###
Which point corresponds to the best time to calculate the terminal value?
Question 398 financial distress, capital raising, leverage, capital structure, NPV
A levered firm has zero-coupon bonds which mature in one year and have a combined face value of $9.9m.
Investors are risk-neutral and therefore all debt and equity holders demand the same required return of 10% pa.
In one year the firm's assets will be worth:
- $13.2m with probability 0.5 in the good state of the world, or
- $6.6m with probability 0.5 in the bad state of the world.
A new project presents itself which requires an investment of $2m and will provide a certain cash flow of $3.3m in one year.
The firm doesn't have any excess cash to make the initial $2m investment, but the funds can be raised from shareholders through a fairly priced rights issue. Ignore all transaction costs.
Should shareholders vote to proceed with the project and equity raising? What will be the gain in shareholder wealth if they decide to proceed?
The below screenshot of Commonwealth Bank of Australia's (CBA) details were taken from the Google Finance website on 7 Nov 2014. Some information has been deliberately blanked out.
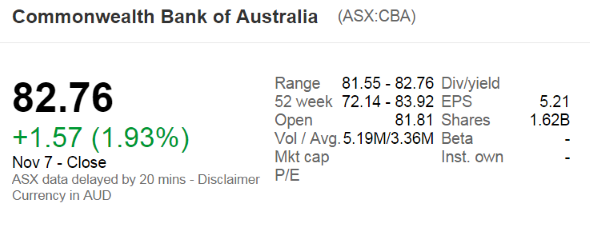
What was CBA's market capitalisation of equity?
Discounted cash flow (DCF) valuation prices assets by finding the present value of the asset's future cash flows. The single cash flow, annuity, and perpetuity equations are very useful for this.
Which of the following equations is the 'perpetuity with growth' equation?
The current gold price is $700, gold storage costs are 2% pa and the risk free rate is 10% pa, both with continuous compounding.
What should be the 3 year gold futures price?
You bought a house, primarily funded using a home loan from a bank. Which of the following statements is NOT correct?
One year ago you bought a $1,000,000 house partly funded using a mortgage loan. The loan size was $800,000 and the other $200,000 was your wealth or 'equity' in the house asset.
The interest rate on the home loan was 4% pa.
Over the year, the house produced a net rental yield of 2% pa and a capital gain of 2.5% pa.
Assuming that all cash flows (interest payments and net rental payments) were paid and received at the end of the year, and all rates are given as effective annual rates, what was the total return on your wealth over the past year?
Hint: Remember that wealth in this context is your equity (E) in the house asset (V = D+E) which is funded by the loan (D) and your deposit or equity (E).
Question 817 expected and historical returns, income and capital returns
Over the last year, a constant-dividend-paying stock's price fell, while it's future expected dividends and profit remained the same. Assume that:
- Now is ##t=0##, last year is ##t=-1## and next year is ##t=1##;
- The dividend is paid at the end of each year, the last dividend was just paid today ##(C_0)## and the next dividend will be paid next year ##(C_1)##;
- Markets are efficient and the dividend discount model is suitable for valuing the stock.
Which of the following statements is NOT correct? The stock's:
Below is the Australian federal government’s budget balance as a percent of GDP. Note that the columns to the right of the vertical black line were a forecast at the time. The x-axis shows financial years, so for example the 06/07 financial year represents the time period from 1 July 2006 to 30 June 2007.
Comparing the 2008/09 financial year to the previous one, the Australian federal government implemented: