A European bond paying annual coupons of 6% offers a yield of 10% pa.
Convert the yield into an effective monthly rate, an effective annual rate and an effective daily rate. Assume that there are 365 days in a year.
All answers are given in the same order:
### r_\text{eff, monthly} , r_\text{eff, yearly} , r_\text{eff, daily} ###
Question 147 bill pricing, simple interest rate, no explanation
A 30-day Bank Accepted Bill has a face value of $1,000,000. The interest rate is 8% pa and there are 365 days in the year. What is its price now?
The following cash flows are expected:
- 10 yearly payments of $80, with the first payment in 3 years from now (first payment at t=3).
- 1 payment of $600 in 5 years and 6 months (t=5.5) from now.
What is the NPV of the cash flows if the discount rate is 10% given as an effective annual rate?
Question 308 risk, standard deviation, variance, no explanation
A stock's standard deviation of returns is expected to be:
- 0.09 per month for the first 5 months;
- 0.14 per month for the next 7 months.
What is the expected standard deviation of the stock per year ##(\sigma_\text{annual})##?
Assume that returns are independently and identically distributed (iid) and therefore have zero auto-correlation.
A 10 year Australian government bond was just issued at par with a yield of 3.9% pa. The fixed coupon payments are semi-annual. The bond has a face value of $1,000.
Six months later, just after the first coupon is paid, the yield of the bond decreases to 3.65% pa. What is the bond's new price?
Question 639 option, option payoff at maturity, no explanation
Which of the below formulas gives the payoff ##(f)## at maturity ##(T)## from being short a put option? Let the underlying asset price at maturity be ##S_T## and the exercise price be ##X_T##.
Below is the Australian federal government’s budget balance as a percent of GDP. Note that the columns to the right of the vertical black line were a forecast at the time. The x-axis shows financial years, so for example the 06/07 financial year represents the time period from 1 July 2006 to 30 June 2007.
Comparing the 2008/09 financial year to the previous one, the Australian federal government implemented:
Question 929 standard error, mean and median returns, mode return, return distribution, arithmetic and geometric averages, continuously compounding rate
The arithmetic average continuously compounded or log gross discrete return (AALGDR) on the ASX200 accumulation index over the 24 years from 31 Dec 1992 to 31 Dec 2016 is 9.49% pa.
The arithmetic standard deviation (SDLGDR) is 16.92 percentage points pa.
Assume that the data are sample statistics, not population statistics. Assume that the log gross discrete returns are normally distributed.
What is the standard error of your estimate of the sample ASX200 accumulation index arithmetic average log gross discrete return (AALGDR) over the 24 years from 1992 to 2016?
Question 976 comparative advantage in trade, production possibilities curve, no explanation
Arthur and Bindi are the only people on a remote island. Their production possibility curves are shown in the graph.
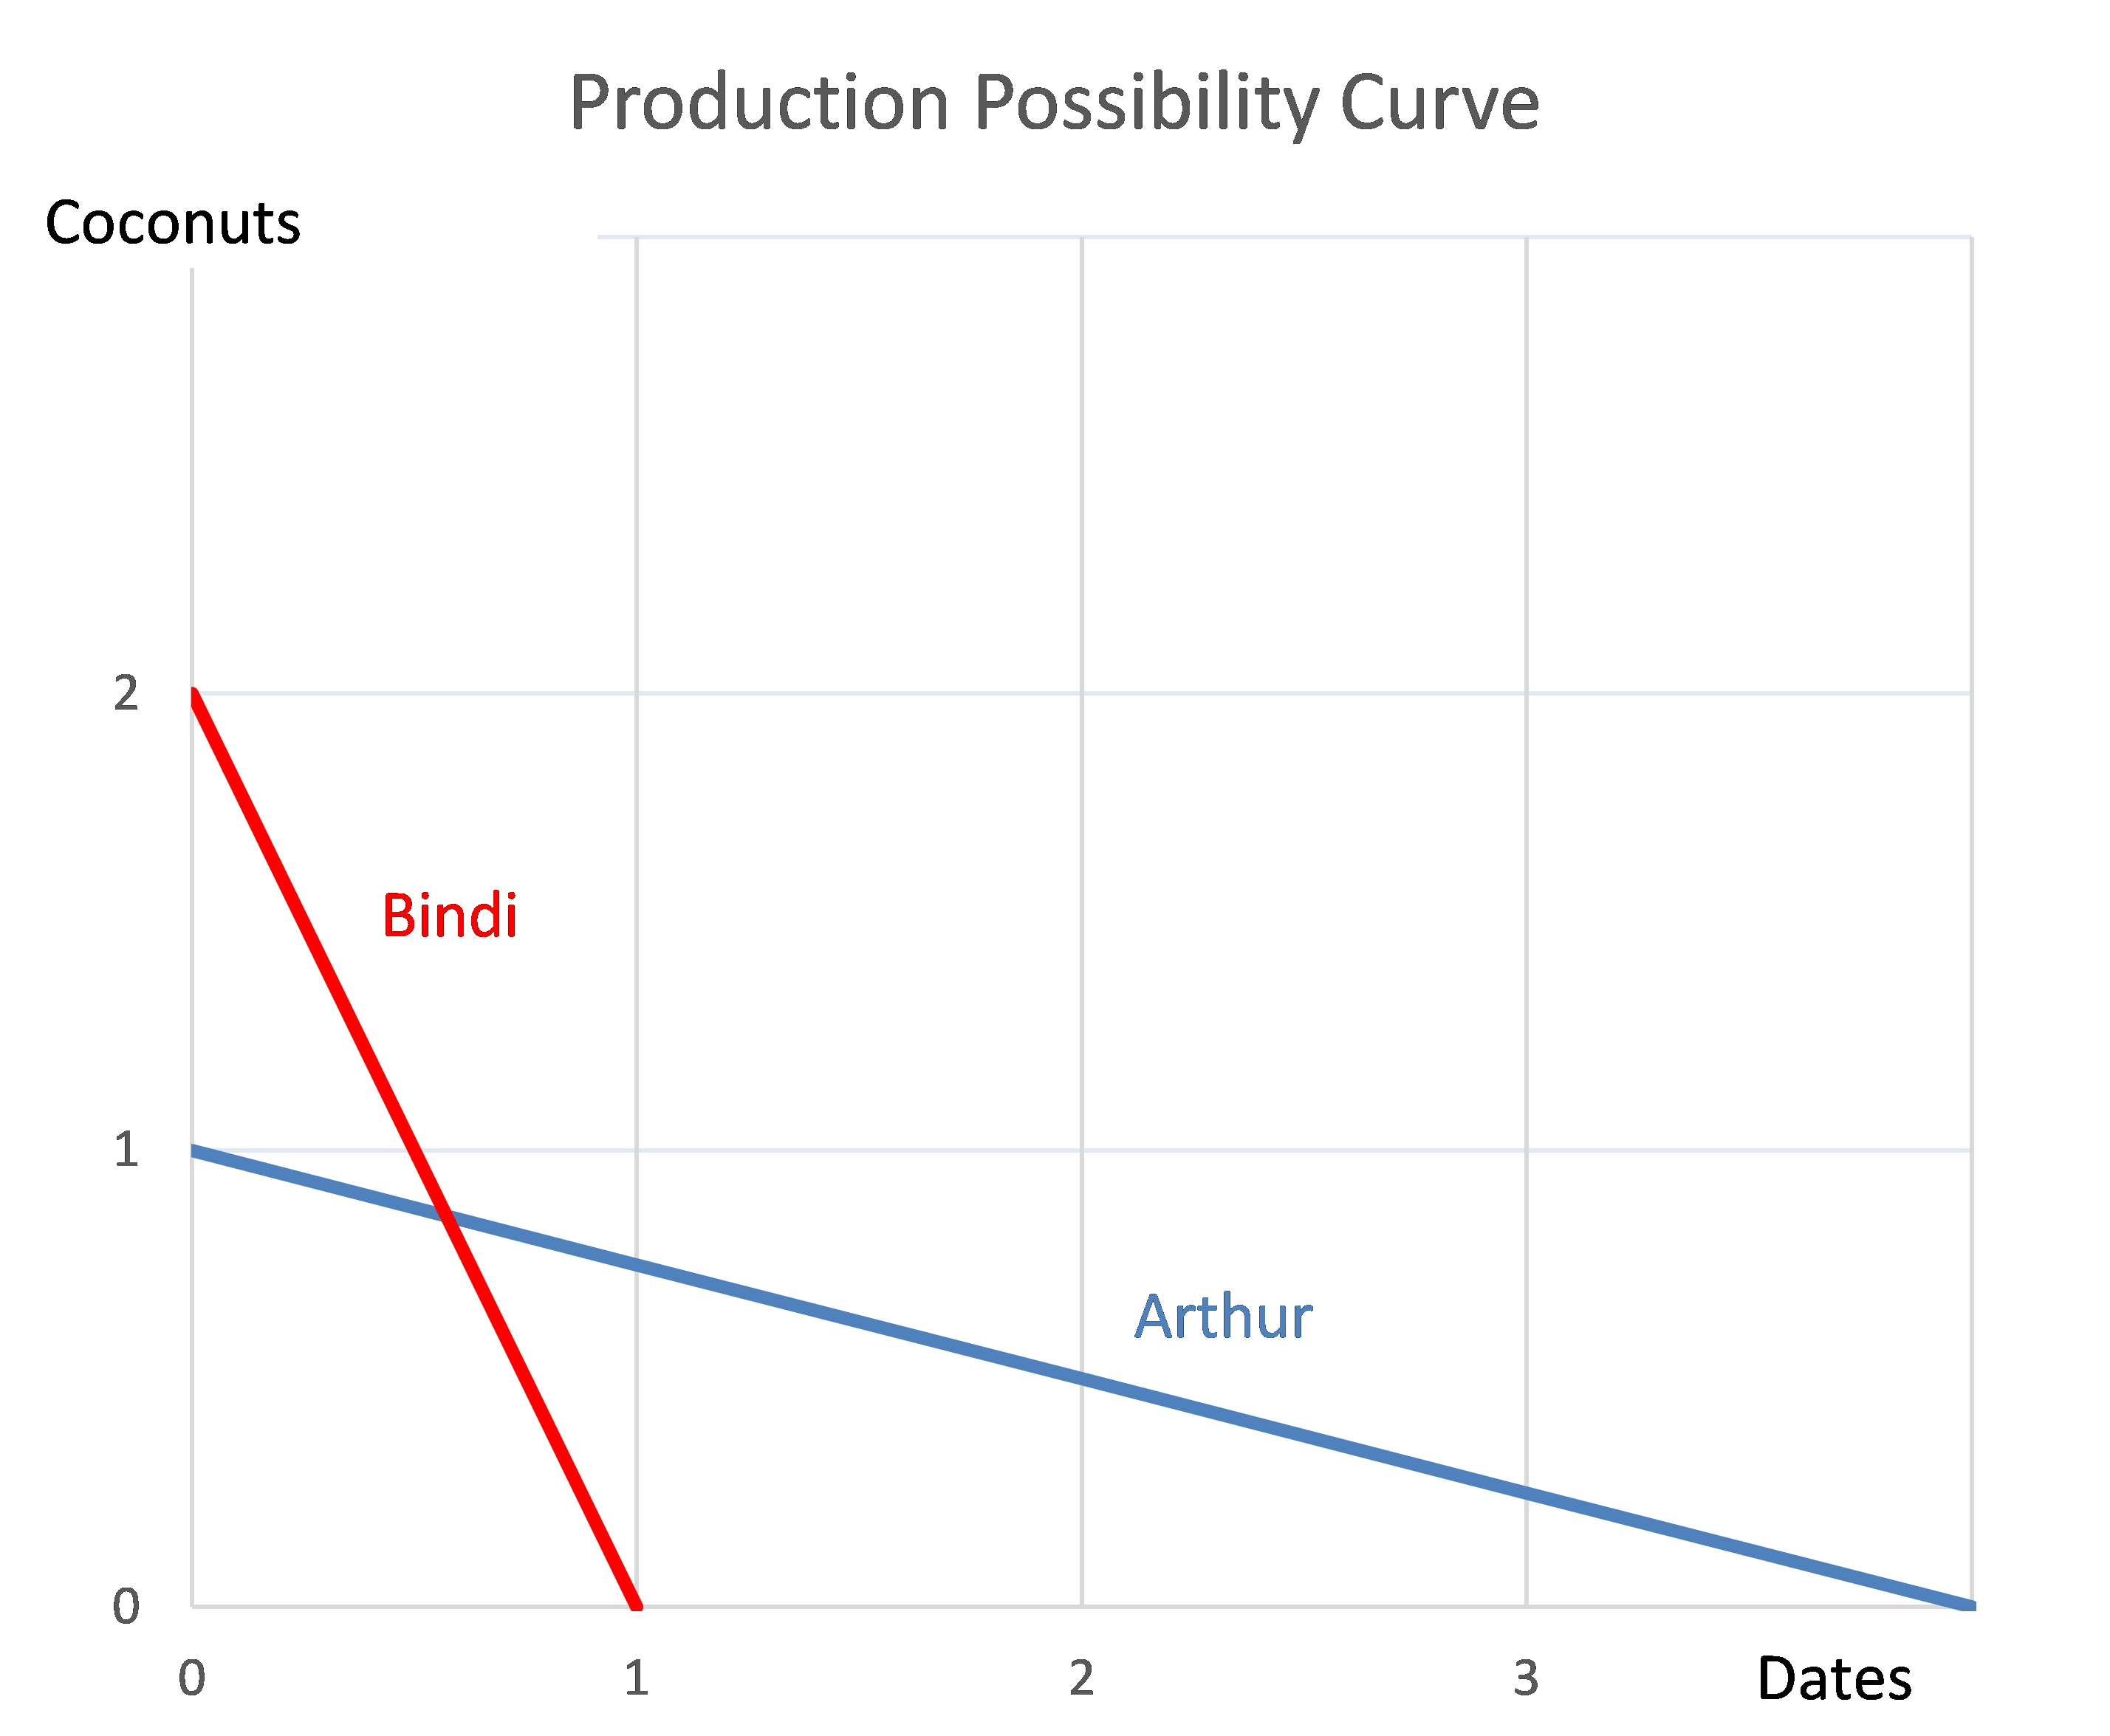
Which of the following statements is NOT correct?