The following equation is the Dividend Discount Model, also known as the 'Gordon Growth Model' or the 'Perpetuity with growth' equation.
###P_0=\frac{d_1}{r-g}###
A stock pays dividends annually. It just paid a dividend, but the next dividend (##d_1##) will be paid in one year.
According to the DDM, what is the correct formula for the expected price of the stock in 2.5 years?
When someone says that they're "buying American dollars" (USD), what type of asset are they probably buying? They're probably buying:
A new company's Firm Free Cash Flow (FFCF, same as CFFA) is forecast in the graph below.
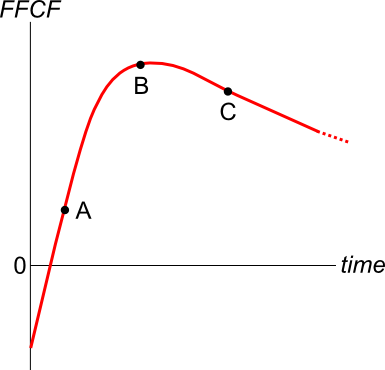
To value the firm's assets, the terminal value needs to be calculated using the perpetuity with growth formula:
###V_{\text{terminal, }t-1} = \dfrac{FFCF_{\text{terminal, }t}}{r-g}###
Which point corresponds to the best time to calculate the terminal value?
The below graph shows a project's net present value (NPV) against its annual discount rate.
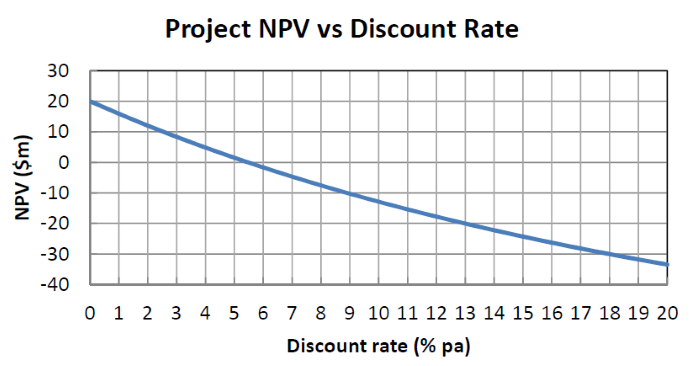
For what discount rate or range of discount rates would you accept and commence the project?
All answer choices are given as approximations from reading off the graph.
Alice, Bob, Chris and Delta are traders in the futures market. The following trades occur over a single day in a newly-opened equity index future that matures in one year which the exchange just made available.
1. Alice buys a future from Bob.
2. Chris buys a future from Delta.
3. Delta buys a future from Bob.
These were the only trades made in this equity index future. What was the trading volume and what is the open interest?
Question 778 CML, systematic and idiosyncratic risk, portfolio risk, CAPM
The capital market line (CML) is shown in the graph below. The total standard deviation is denoted by σ and the expected return is μ. Assume that markets are efficient so all assets are fairly priced.
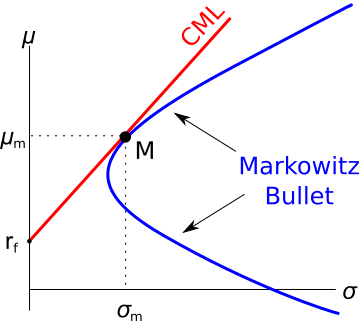
Which of the below statements is NOT correct?
Being long a call and short a put which have the same exercise prices and underlying stock is equivalent to being:
Which of the following statements about bond convexity is NOT correct?
Question 928 mean and median returns, mode return, return distribution, arithmetic and geometric averages, continuously compounding rate, no explanation
The arithmetic average continuously compounded or log gross discrete return (AALGDR) on the ASX200 accumulation index over the 24 years from 31 Dec 1992 to 31 Dec 2016 is 9.49% pa.
The arithmetic standard deviation (SDLGDR) is 16.92 percentage points pa.
Assume that the log gross discrete returns are normally distributed and that the above estimates are true population statistics, not sample statistics, so there is no standard error in the sample mean or standard deviation estimates. Also assume that the standardised normal Z-statistic corresponding to a one-tail probability of 2.5% is exactly -1.96.
If you had a $1 million fund that replicated the ASX200 accumulation index, in how many years would the mode dollar value of your fund first be expected to lie outside the 95% confidence interval forecast?
Note that the mode of a log-normally distributed future price is: ##P_{T \text{ mode}} = P_0.e^{(\text{AALGDR} - \text{SDLGDR}^2 ).T} ##