A European company just issued two bonds, a
- 3 year zero coupon bond at a yield of 6% pa, and a
- 4 year zero coupon bond at a yield of 6.5% pa.
What is the company's forward rate over the fourth year (from t=3 to t=4)? Give your answer as an effective annual rate, which is how the above bond yields are quoted.
A new company's Firm Free Cash Flow (FFCF, same as CFFA) is forecast in the graph below.
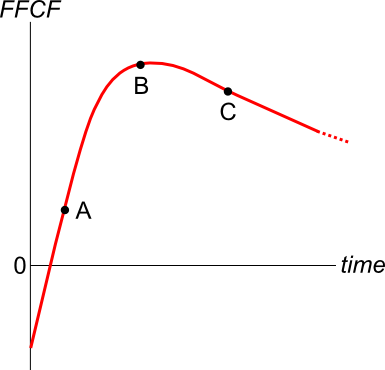
To value the firm's assets, the terminal value needs to be calculated using the perpetuity with growth formula:
###V_{\text{terminal, }t-1} = \dfrac{FFCF_{\text{terminal, }t}}{r-g}###
Which point corresponds to the best time to calculate the terminal value?
Question 386 Merton model of corporate debt, real option, option
A risky firm will last for one period only (t=0 to 1), then it will be liquidated. So it's assets will be sold and the debt holders and equity holders will be paid out in that order. The firm has the following quantities:
##V## = Market value of assets.
##E## = Market value of (levered) equity.
##D## = Market value of zero coupon bonds.
##F_1## = Total face value of zero coupon bonds which is promised to be paid in one year.
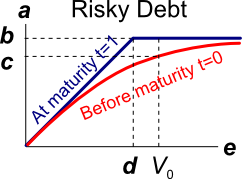
The risky corporate debt graph above contains bold labels a to e. Which of the following statements about those labels is NOT correct?
A European put option will mature in ##T## years with a strike price of ##K## dollars. The underlying asset has a price of ##S## dollars.
What is an expression for the payoff at maturity ##(f_T)## in dollars from owning (being long) the put option?
Some countries' interest rates are so low that they're zero.
If interest rates are 0% pa and are expected to stay at that level for the foreseeable future, what is the most that you would be prepared to pay a bank now if it offered to pay you $10 at the end of every year for the next 5 years?
In other words, what is the present value of five $10 payments at time 1, 2, 3, 4 and 5 if interest rates are 0% pa?
Estimate the French bank Societe Generale's share price using a backward-looking price earnings (PE) multiples approach with the following assumptions and figures only. Note that EUR is the euro, the European monetary union's currency.
- The 4 major European banks Credit Agricole (ACA), Deutsche Bank AG (DBK), UniCredit (UCG) and Banco Santander (SAN) are comparable companies to Societe Generale (GLE);
- Societe Generale's (GLE's) historical earnings per share (EPS) is EUR 2.92;
- ACA's backward-looking PE ratio is 16.29 and historical EPS is EUR 0.84;
- DBK's backward-looking PE ratio is 25.01 and historical EPS is EUR 1.26;
- SAN's backward-looking PE ratio is 14.71 and historical EPS is EUR 0.47;
- UCG's backward-looking PE ratio is 15.78 and historical EPS is EUR 0.40;
Note: Figures sourced from Google Finance on 27 March 2015.
Question 728 inflation, real and nominal returns and cash flows, income and capital returns, no explanation
Which of the following statements about gold is NOT correct? Assume that the gold price increases by inflation. Gold has a:
Question 790 mean and median returns, return distribution, arithmetic and geometric averages, continuously compounding rate, log-normal distribution, VaR, confidence interval
A risk manager has identified that their hedge fund’s continuously compounded portfolio returns are normally distributed with a mean of 10% pa and a standard deviation of 30% pa. The hedge fund’s portfolio is currently valued at $100 million. Assume that there is no estimation error in these figures and that the normal cumulative density function at 1.644853627 is 95%.
Which of the following statements is NOT correct? All answers are rounded to the nearest dollar.
Question 922 Stutzer portfolio performance indicator, Sharpe ratio, no explanation
Stutzer’s Portfolio Performance Indicator (PPI) ranks portfolios similarly to what other performance metric, assuming that the portfolios’ continuously compounded returns (LGDR’s) are normally distributed?
Question 925 mean and median returns, return distribution, arithmetic and geometric averages, continuously compounding rate, no explanation
The arithmetic average and standard deviation of returns on the ASX200 accumulation index over the 24 years from 31 Dec 1992 to 31 Dec 2016 were calculated as follows:
###\bar{r}_\text{yearly} = \dfrac{ \displaystyle\sum\limits_{t=1992}^{24}{\left( \ln \left( \dfrac{P_{t+1}}{P_t} \right) \right)} }{T} = \text{AALGDR} =0.0949=9.49\% \text{ pa}###
###\sigma_\text{yearly} = \dfrac{ \displaystyle\sum\limits_{t=1992}^{24}{\left( \left( \ln \left( \dfrac{P_{t+1}}{P_t} \right) - \bar{r}_\text{yearly} \right)^2 \right)} }{T} = \text{SDLGDR} = 0.1692=16.92\text{ pp pa}###
Assume that the log gross discrete returns are normally distributed and that the above estimates are true population statistics, not sample statistics, so there is no standard error in the sample mean or standard deviation estimates. Also assume that the standardised normal Z-statistic corresponding to a one-tail probability of 2.5% is exactly -1.96.
Which of the following statements is NOT correct? If you invested $1m today in the ASX200, then over the next 4 years: