The following equation is called the Dividend Discount Model (DDM), Gordon Growth Model or the perpetuity with growth formula: ### P_0 = \frac{ C_1 }{ r - g } ###
What is ##g##? The value ##g## is the long term expected:
You want to buy an apartment priced at $300,000. You have saved a deposit of $30,000. The bank has agreed to lend you the $270,000 as an interest only loan with a term of 25 years. The interest rate is 12% pa and is not expected to change.
What will be your monthly payments? Remember that mortgage payments are paid in arrears (at the end of the month).
The phone company Telstra have 2 mobile service plans on offer which both have the same amount of phone call, text message and internet data credit. Both plans have a contract length of 24 months and the monthly cost is payable in advance. The only difference between the two plans is that one is a:
- 'Bring Your Own' (BYO) mobile service plan, costing $50 per month. There is no phone included in this plan. The other plan is a:
- 'Bundled' mobile service plan that comes with the latest smart phone, costing $71 per month. This plan includes the latest smart phone.
Neither plan has any additional payments at the start or end.
The only difference between the plans is the phone, so what is the implied cost of the phone as a present value?
Assume that the discount rate is 2% per month given as an effective monthly rate, the same high interest rate on credit cards.
The theory of fixed interest bond pricing is an application of the theory of Net Present Value (NPV). Also, a 'fairly priced' asset is not over- or under-priced. Buying or selling a fairly priced asset has an NPV of zero.
Considering this, which of the following statements is NOT correct?
A firm's weighted average cost of capital before tax (##r_\text{WACC before tax}##) would increase due to:
When using the dividend discount model to price a stock:
### p_{0} = \frac{d_1}{r - g} ###
The growth rate of dividends (g):
Find UniBar Corp's Cash Flow From Assets (CFFA), also known as Free Cash Flow to the Firm (FCFF), over the year ending 30th June 2013.
| UniBar Corp | ||
| Income Statement for | ||
| year ending 30th June 2013 | ||
| $m | ||
| Sales | 80 | |
| COGS | 40 | |
| Operating expense | 15 | |
| Depreciation | 10 | |
| Interest expense | 5 | |
| Income before tax | 10 | |
| Tax at 30% | 3 | |
| Net income | 7 | |
| UniBar Corp | ||
| Balance Sheet | ||
| as at 30th June | 2013 | 2012 |
| $m | $m | |
| Assets | ||
| Current assets | 120 | 90 |
| PPE | ||
| Cost | 360 | 320 |
| Accumul. depr. | 40 | 30 |
| Carrying amount | 320 | 290 |
| Total assets | 440 | 380 |
| Liabilities | ||
| Current liabilities | 110 | 60 |
| Non-current liabilities | 190 | 180 |
| Owners' equity | ||
| Retained earnings | 95 | 95 |
| Contributed equity | 45 | 45 |
| Total L and OE | 440 | 380 |
Note: all figures are given in millions of dollars ($m).
The following table shows a sample of historical total returns of shares in two different companies A and B.
| Stock Returns | ||
| Total effective annual returns | ||
| Year | ##r_A## | ##r_B## |
| 2007 | 0.2 | 0.4 |
| 2008 | 0.04 | -0.2 |
| 2009 | -0.1 | -0.3 |
| 2010 | 0.18 | 0.5 |
What is the historical sample covariance (##\hat{\sigma}_{A,B}##) and correlation (##\rho_{A,B}##) of stock A and B's total effective annual returns?
Find the sample standard deviation of returns using the data in the table:
| Stock Returns | |
| Year | Return pa |
| 2008 | 0.3 |
| 2009 | 0.02 |
| 2010 | -0.2 |
| 2011 | 0.4 |
The returns above and standard deviations below are given in decimal form.
In the 1997 Asian financial crisis many countries' exchange rates depreciated rapidly against the US dollar (USD). The Thai, Indonesian, Malaysian, Korean and Filipino currencies were severely affected. The below graph shows these Asian countries' currencies in USD per one unit of their currency, indexed to 100 in June 1997.
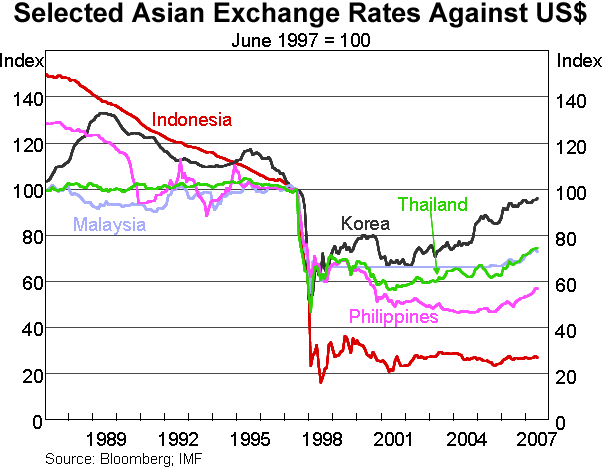
Of the statements below, which is NOT correct? The Asian countries':