The following equation is called the Dividend Discount Model (DDM), Gordon Growth Model or the perpetuity with growth formula: ### P_0 = \frac{ C_1 }{ r - g } ###
What is ##g##? The value ##g## is the long term expected:
The below graph shows a project's net present value (NPV) against its annual discount rate.
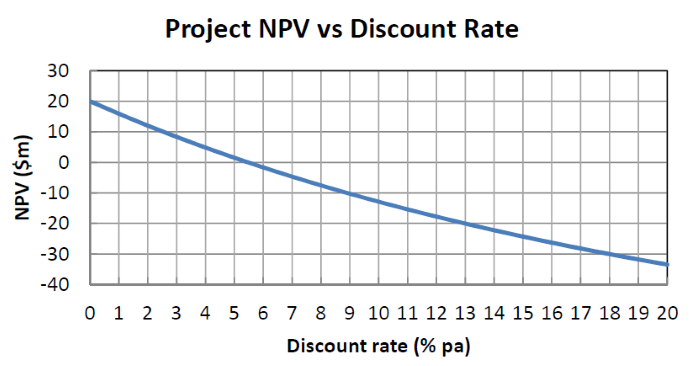
Which of the following statements is NOT correct?
Question 513 stock split, reverse stock split, stock dividend, bonus issue, rights issue
Which of the following statements is NOT correct?
Question 760 time calculation, interest only loan, no explanation
Five years ago (##t=-5## years) you entered into an interest-only home loan with a principal of $500,000, an interest rate of 4.5% pa compounding monthly with a term of 25 years.
Then interest rates suddenly fall to 3% pa (##t=0##), but you continue to pay the same monthly home loan payments as you did before. Will your home loan be paid off by the end of its remaining term? If so, in how many years from now? Measure the time taken to pay off the home loan from the current time which is 5 years after the home loan was first entered into.
Assume that the lower interest rate was given to you immediately after the loan repayment at the end of year 5, which was the 60th payment since the loan was granted. Also assume that rates were and are expected to remain constant.
Use the below information to value a levered company with constant annual perpetual cash flows from assets. The next cash flow will be generated in one year from now, so a perpetuity can be used to value this firm. Both the operating and firm free cash flows are constant (but not equal to each other).
| Data on a Levered Firm with Perpetual Cash Flows | ||
| Item abbreviation | Value | Item full name |
| ##\text{OFCF}## | $48.5m | Operating free cash flow |
| ##\text{FFCF or CFFA}## | $50m | Firm free cash flow or cash flow from assets |
| ##g## | 0% pa | Growth rate of OFCF and FFCF |
| ##\text{WACC}_\text{BeforeTax}## | 10% pa | Weighted average cost of capital before tax |
| ##\text{WACC}_\text{AfterTax}## | 9.7% pa | Weighted average cost of capital after tax |
| ##r_\text{D}## | 5% pa | Cost of debt |
| ##r_\text{EL}## | 11.25% pa | Cost of levered equity |
| ##D/V_L## | 20% pa | Debt to assets ratio, where the asset value includes tax shields |
| ##t_c## | 30% | Corporate tax rate |
What is the value of the levered firm including interest tax shields?
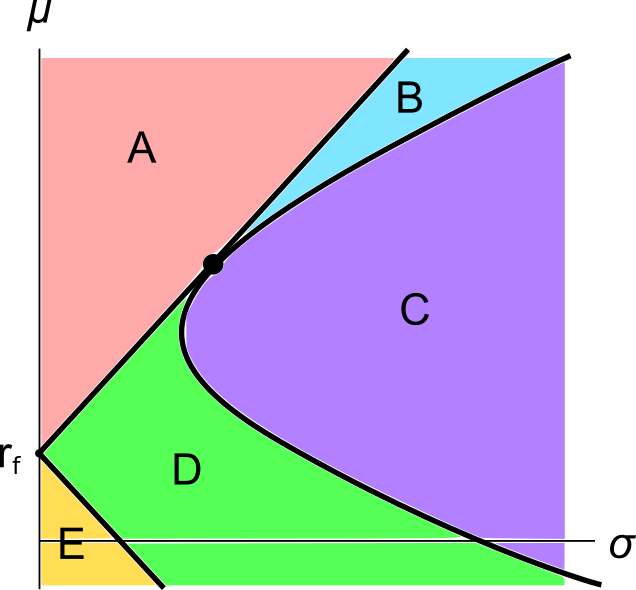
A graph of assets’ expected returns ##(\mu)## versus standard deviations ##(\sigma)## is given in the below diagram.
Each letter corresponds to a separate coloured area. The portfolios at the boundary of the areas, on the black lines, are excluded from each area. Assume that all assets represented in this graph are fairly priced, and that all risky assets can be short-sold.
Which of the following statements about this graph and Markowitz portfolio theory is NOT correct?
Question 817 expected and historical returns, income and capital returns
Over the last year, a constant-dividend-paying stock's price fell, while it's future expected dividends and profit remained the same. Assume that:
- Now is ##t=0##, last year is ##t=-1## and next year is ##t=1##;
- The dividend is paid at the end of each year, the last dividend was just paid today ##(C_0)## and the next dividend will be paid next year ##(C_1)##;
- Markets are efficient and the dividend discount model is suitable for valuing the stock.
Which of the following statements is NOT correct? The stock's:
Question 894 balance of payments, current account, no explanation
Below are four graphs of Australia's external position, published in the RBA's chart pack.
Assume that all assets and liabilities are debt which makes interest income and equity which makes dividend income.
Which of the following statements is NOT correct? As at the end of 2017, Australia’s:
A stock has an expected return of 10% pa and you're 90% sure that over the next year, the return will be between -15% and 35%. The stock's returns are normally distributed. Note that the Z-statistic corresponding to a one-tail:
- 90% normal probability density function is 1.282.
- 95% normal probability density function is 1.645.
- 97.5% normal probability density function is 1.960.
What is the stock’s standard deviation of returns in percentage points per annum (pp pa)?