The following equation is called the Dividend Discount Model (DDM), Gordon Growth Model or the perpetuity with growth formula: ### P_0 = \frac{ C_1 }{ r - g } ###
What is ##g##? The value ##g## is the long term expected:
A two year Government bond has a face value of $100, a yield of 2.5% pa and a fixed coupon rate of 0.5% pa, paid semi-annually. What is its price?
A wholesale building supplies business offers credit to its customers. Customers are given 60 days to pay for their goods, but if they pay within 7 days they will get a 2% discount.
What is the effective interest rate implicit in the discount being offered?
Assume 365 days in a year and that all customers pay on either the 7th day or the 60th day. All rates given below are effective annual rates.
A stock just paid its annual dividend of $9. The share price is $60. The required return of the stock is 10% pa as an effective annual rate.
What is the implied growth rate of the dividend per year?
A new company's Firm Free Cash Flow (FFCF, same as CFFA) is forecast in the graph below.
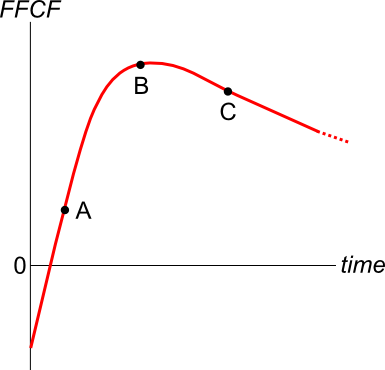
To value the firm's assets, the terminal value needs to be calculated using the perpetuity with growth formula:
###V_{\text{terminal, }t-1} = \dfrac{FFCF_{\text{terminal, }t}}{r-g}###
Which point corresponds to the best time to calculate the terminal value?
Find Sidebar Corporation's Cash Flow From Assets (CFFA), also known as Free Cash Flow to the Firm (FCFF), over the year ending 30th June 2013.
| Sidebar Corp | ||
| Income Statement for | ||
| year ending 30th June 2013 | ||
| $m | ||
| Sales | 405 | |
| COGS | 100 | |
| Depreciation | 34 | |
| Rent expense | 22 | |
| Interest expense | 39 | |
| Taxable Income | 210 | |
| Taxes at 30% | 63 | |
| Net income | 147 | |
| Sidebar Corp | ||
| Balance Sheet | ||
| as at 30th June | 2013 | 2012 |
| $m | $m | |
| Cash | 0 | 0 |
| Inventory | 70 | 50 |
| Trade debtors | 11 | 16 |
| Rent paid in advance | 4 | 3 |
| PPE | 700 | 680 |
| Total assets | 785 | 749 |
| Trade creditors | 11 | 19 |
| Bond liabilities | 400 | 390 |
| Contributed equity | 220 | 220 |
| Retained profits | 154 | 120 |
| Total L and OE | 785 | 749 |
Note: All figures are given in millions of dollars ($m).
The cash flow from assets was:
Acquirer firm plans to launch a takeover of Target firm. The deal is expected to create a present value of synergies totaling $0.5 million, but investment bank fees and integration costs with a present value of $1.5 million is expected. A 10% cash and 90% scrip offer will be made that pays the fair price for the target's shares only. Assume that the Target and Acquirer agree to the deal. The cash will be paid out of the firms' cash holdings, no new debt or equity will be raised.
| Firms Involved in the Takeover | ||
| Acquirer | Target | |
| Assets ($m) | 60 | 10 |
| Debt ($m) | 20 | 2 |
| Share price ($) | 10 | 8 |
| Number of shares (m) | 4 | 1 |
Assume that the firms' debt and equity are fairly priced, and that each firms' debts' risk, yield and values remain constant. The acquisition is planned to occur immediately, so ignore the time value of money.
Calculate the merged firm's share price and total number of shares after the takeover has been completed.
A stock is expected to pay its semi-annual dividend of $1 per share for the foreseeable future. The current stock price is $40 and the continuously compounded risk free rate is 3% pa for all maturities. An investor has just taken a long position in a 12-month futures contract on the stock. The last dividend payment was exactly 4 months ago. Therefore the next $1 dividend is in 2 months, and the $1 dividend after is 8 months from now. Which of the following statements about this scenario is NOT correct?
Question 928 mean and median returns, mode return, return distribution, arithmetic and geometric averages, continuously compounding rate, no explanation
The arithmetic average continuously compounded or log gross discrete return (AALGDR) on the ASX200 accumulation index over the 24 years from 31 Dec 1992 to 31 Dec 2016 is 9.49% pa.
The arithmetic standard deviation (SDLGDR) is 16.92 percentage points pa.
Assume that the log gross discrete returns are normally distributed and that the above estimates are true population statistics, not sample statistics, so there is no standard error in the sample mean or standard deviation estimates. Also assume that the standardised normal Z-statistic corresponding to a one-tail probability of 2.5% is exactly -1.96.
If you had a $1 million fund that replicated the ASX200 accumulation index, in how many years would the mode dollar value of your fund first be expected to lie outside the 95% confidence interval forecast?
Note that the mode of a log-normally distributed future price is: ##P_{T \text{ mode}} = P_0.e^{(\text{AALGDR} - \text{SDLGDR}^2 ).T} ##