A 10 year Australian government bond was just issued at par with a yield of 3.9% pa. The fixed coupon payments are semi-annual. The bond has a face value of $1,000.
Six months later, just after the first coupon is paid, the yield of the bond decreases to 3.65% pa. What is the bond's new price?
Which firms tend to have low forward-looking price-earnings (PE) ratios? Only consider firms with positive PE ratios.
A firm is considering a business project which costs $11m now and is expected to pay a constant $1m at the end of every year forever.
Assume that the initial $11m cost is funded using the firm's existing cash so no new equity or debt will be raised. The cost of capital is 10% pa.
Which of the following statements about net present value (NPV), internal rate of return (IRR) and payback period is NOT correct?
Question 543 price gains and returns over time, IRR, NPV, income and capital returns, effective return
For an asset price to triple every 5 years, what must be the expected future capital return, given as an effective annual rate?
An equity index is currently at 5,000 points. The 2 year futures price is 5,400 points and the total required return is 8% pa with continuous compounding. Each index point is worth $25.
What is the implied continuous dividend yield as a continuously compounded rate per annum?
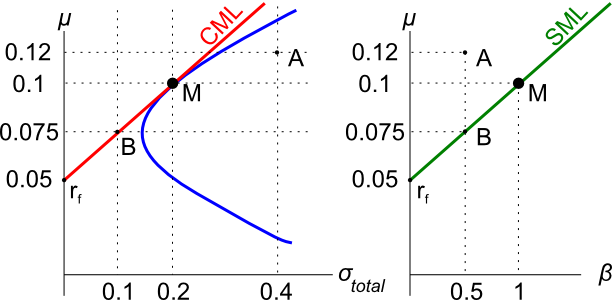
Assets A, B, M and ##r_f## are shown on the graphs above. Asset M is the market portfolio and ##r_f## is the risk free yield on government bonds. Assume that investors can borrow and lend at the risk free rate. Which of the below statements is NOT correct?
Question 748 income and capital returns, DDM, ex dividend date
A stock will pay you a dividend of $2 tonight if you buy it today.
Thereafter the annual dividend is expected to grow by 3% pa, so the next dividend after the $2 one tonight will be $2.06 in one year, then in two years it will be $2.1218 and so on. The stock's required return is 8% pa.
What is the stock price today and what do you expect the stock price to be tomorrow, approximately?
Question 850 gross domestic product, gross domestic product per capita
Below is a table showing some countries’ GDP, population and GDP per capita.
| Countries' GDP and Population | |||
| GDP | Population | GDP per capita | |
| USD million | millions of people | USD | |
| United States | 18,036,648 | 325 | 55,492 |
| China | 11,158,457 | 1,383 | 8,066 |
| Japan | 4,383,076 | 127 | 34,586 |
| Germany | 3,363,600 | 83 | 40,623 |
| Norway | 500,519 | 5 | 95,027 |
Source: "GDP and its breakdown at current prices in US Dollars" United Nations Statistics Division. December 2016.
Using this data only, which one of these countries’ citizens have the highest living standards?