If a project's net present value (NPV) is zero, then its internal rate of return (IRR) will be:
A stock is expected to pay the following dividends:
| Cash Flows of a Stock | ||||||
| Time (yrs) | 0 | 1 | 2 | 3 | 4 | ... |
| Dividend ($) | 8 | 8 | 8 | 20 | 8 | ... |
After year 4, the dividend will grow in perpetuity at 4% pa. The required return on the stock is 10% pa. Both the growth rate and required return are given as effective annual rates. Note that the $8 dividend at time zero is about to be paid tonight.
What will be the price of the stock in 5 years (t = 5), just after the dividend at that time has been paid?
Question 381 Merton model of corporate debt, option, real option
In the Merton model of corporate debt, buying a levered company's debt is equivalent to buying risk free government bonds and:
Discounted cash flow (DCF) valuation prices assets by finding the present value of the asset's future cash flows. The single cash flow, annuity, and perpetuity equations are very useful for this.
Which of the following equations is the 'perpetuity with growth' equation?
Question 576 inflation, real and nominal returns and cash flows
What is the present value of a nominal payment of $1,000 in 4 years? The nominal discount rate is 8% pa and the inflation rate is 2% pa.
An equity index is currently at 4,800 points. The 1.5 year futures price is 5,100 points and the total required return is 6% pa with continuous compounding. Each index point is worth $25.
What is the implied dividend yield as a continuously compounded rate per annum?
Question 797 option, Black-Scholes-Merton option pricing, option delta, no explanation
Which of the following quantities from the Black-Scholes-Merton option pricing formula gives the risk-neutral probability that a European put option will be exercised?
Question 809 Markowitz portfolio theory, CAPM, Jensens alpha, CML, systematic and idiosyncratic risk
A graph of assets’ expected returns ##(\mu)## versus standard deviations ##(\sigma)## is given in the graph below. The CML is the capital market line.
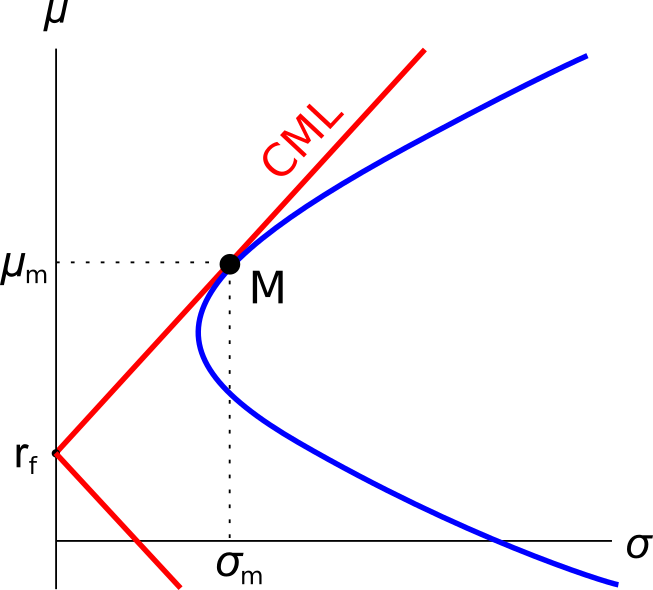
Which of the following statements about this graph, Markowitz portfolio theory and the Capital Asset Pricing Model (CAPM) theory is NOT correct?
Question 859 money supply, no explanation
The below table shows Australian monetary aggregates. Note that ‘M3’ is the sum of all the figures in the table and ‘ADI’ stands for Authorised Deposit-taking Institution such as a bank, building society or credit union.
| Australian Monetary Aggregates | ||||||
| March 2017, AUD billions | ||||||
| Currency | Current deposits with banks |
Certificates of deposit issued by banks |
Term deposits with banks |
Other deposits with banks |
Deposits with non-bank ADIs |
M3 |
| 69.3 | 271.6 | 207.2 | 562.3 | 838.7 | 36.9 | 1986.0 |
Source: RBA Statistical Table D3 Monetary Aggregates.
Which of the following statements is NOT correct?