A stock is expected to pay the following dividends:
| Cash Flows of a Stock | ||||||
| Time (yrs) | 0 | 1 | 2 | 3 | 4 | ... |
| Dividend ($) | 0.00 | 1.00 | 1.05 | 1.10 | 1.15 | ... |
After year 4, the annual dividend will grow in perpetuity at 5% pa, so;
- the dividend at t=5 will be $1.15(1+0.05),
- the dividend at t=6 will be $1.15(1+0.05)^2, and so on.
The required return on the stock is 10% pa. Both the growth rate and required return are given as effective annual rates. What is the current price of the stock?
A share just paid its semi-annual dividend of $10. The dividend is expected to grow at 2% every 6 months forever. This 2% growth rate is an effective 6 month rate. Therefore the next dividend will be $10.20 in six months. The required return of the stock is 10% pa, given as an effective annual rate.
What is the price of the share now?
The following equation is the Dividend Discount Model, also known as the 'Gordon Growth Model' or the 'Perpetuity with growth' equation.
### p_0= \frac{c_1}{r-g} ###
Which expression is equal to the expected dividend return?
Which business structure or structures have the advantage of limited liability for equity investors?
What type of present value equation is best suited to value a residential house investment property that is expected to pay constant rental payments forever? Note that 'constant' has the same meaning as 'level' in this context.
The following cash flows are expected:
- 10 yearly payments of $80, with the first payment in 6.5 years from now (first payment at t=6.5).
- A single payment of $500 in 4 years and 3 months (t=4.25) from now.
What is the NPV of the cash flows if the discount rate is 10% given as an effective annual rate?
Question 543 price gains and returns over time, IRR, NPV, income and capital returns, effective return
For an asset price to triple every 5 years, what must be the expected future capital return, given as an effective annual rate?
Which of the following statements about futures and forward contracts is NOT correct?
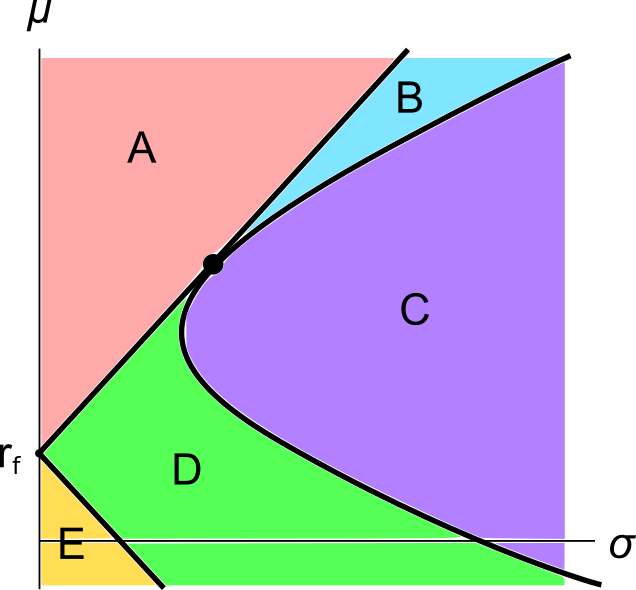
A graph of assets’ expected returns ##(\mu)## versus standard deviations ##(\sigma)## is given in the below diagram.
Each letter corresponds to a separate coloured area. The portfolios at the boundary of the areas, on the black lines, are excluded from each area. Assume that all assets represented in this graph are fairly priced, and that all risky assets can be short-sold.
Which of the following statements about this graph and Markowitz portfolio theory is NOT correct?
Below is the Australian federal government’s budget balance as a percent of GDP. Note that the columns to the right of the vertical black line were a forecast at the time. The x-axis shows financial years, so for example the 06/07 financial year represents the time period from 1 July 2006 to 30 June 2007.
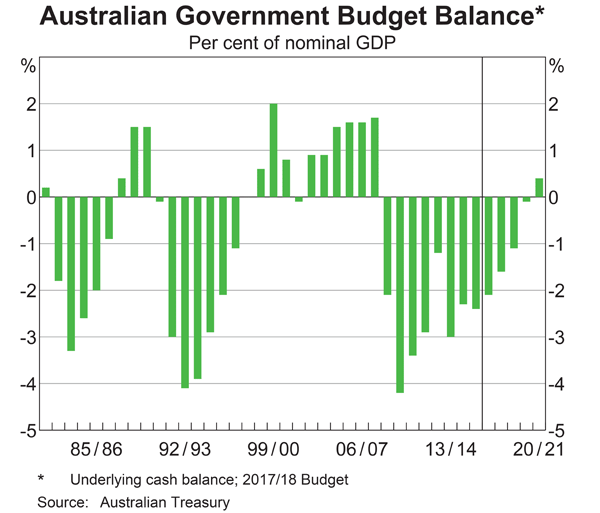
Comparing the 2008/09 financial year to the previous one, the Australian federal government implemented: