A stock is expected to pay the following dividends:
| Cash Flows of a Stock | ||||||
| Time (yrs) | 0 | 1 | 2 | 3 | 4 | ... |
| Dividend ($) | 0.00 | 1.00 | 1.05 | 1.10 | 1.15 | ... |
After year 4, the annual dividend will grow in perpetuity at 5% pa, so;
- the dividend at t=5 will be $1.15(1+0.05),
- the dividend at t=6 will be $1.15(1+0.05)^2, and so on.
The required return on the stock is 10% pa. Both the growth rate and required return are given as effective annual rates. What is the current price of the stock?
A project to build a toll road will take 3 years to complete, costing three payments of $50 million, paid at the start of each year (at times 0, 1, and 2).
After completion, the toll road will yield a constant $10 million at the end of each year forever with no costs. So the first payment will be at t=4.
The required return of the project is 10% pa given as an effective nominal rate. All cash flows are nominal.
What is the payback period?
A firm wishes to raise $8 million now. They will issue 7% pa semi-annual coupon bonds that will mature in 10 years and have a face value of $100 each. Bond yields are 10% pa, given as an APR compounding every 6 months, and the yield curve is flat.
How many bonds should the firm issue?
A home loan company advertises an interest rate of 6% pa, payable monthly. Which of the following statements about the interest rate is NOT correct? All rates are given to four decimal places.
Question 668 buy and hold, market efficiency, idiom
A quote from the famous investor Warren Buffet: "Much success can be attributed to inactivity. Most investors cannot resist the temptation to constantly buy and sell."
Buffet is referring to the buy-and-hold strategy which is to buy and never sell shares. Which of the following is a disadvantage of a buy-and-hold strategy? Assume that share markets are semi-strong form efficient. Which of the following is NOT an advantage of the strict buy-and-hold strategy? A disadvantage of the buy-and-hold strategy is that it reduces:
Question 807 market efficiency, expected and historical returns, CAPM, beta, systematic risk, no explanation
You work in Asia and just woke up. It looked like a nice day but then you read the news and found out that last night the American share market fell by 10% while you were asleep due to surprisingly poor macro-economic world news. You own a portfolio of liquid stocks listed in Asia with a beta of 1.6. When the Asian equity markets open, what do you expect to happen to your share portfolio? Assume that the capital asset pricing model (CAPM) is correct and that the market portfolio contains all shares in the world, of which American shares are a big part. Your portfolio beta is measured against this world market portfolio.
When the Asian equity market opens for trade, you would expect your portfolio value to:
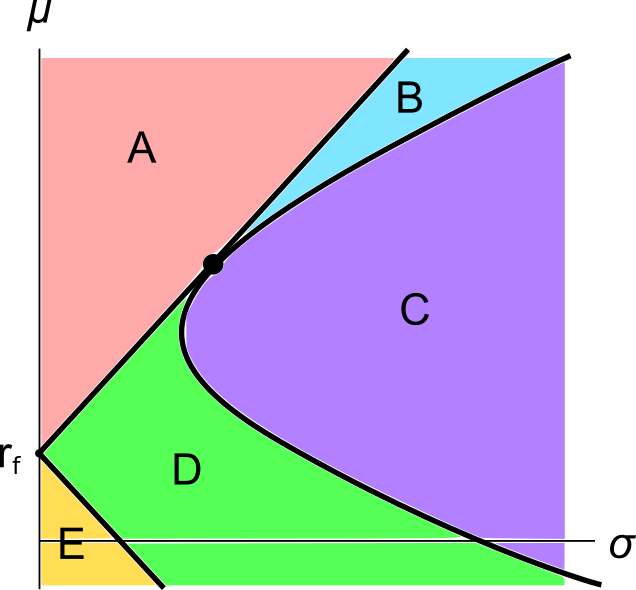
A graph of assets’ expected returns ##(\mu)## versus standard deviations ##(\sigma)## is given in the below diagram.
Each letter corresponds to a separate coloured area. The portfolios at the boundary of the areas, on the black lines, are excluded from each area. Assume that all assets represented in this graph are fairly priced, and that all risky assets can be short-sold.
Which of the following statements about this graph and Markowitz portfolio theory is NOT correct?
A stock, a call, a put and a bond are available to trade. The call and put options' underlying asset is the stock they and have the same strike prices, ##K_T##.
Being long the call and short the stock is equivalent to being:
A one year European-style call option has a strike price of $4. The option's underlying stock pays no dividends and currently trades at $5. The risk-free interest rate is 10% pa continuously compounded. Use a single step binomial tree to calculate the option price, assuming that the price could rise to $8 ##(u = 1.6)## or fall to $3.125 ##(d = 1/1.6)## in one year. The call option price now is: