The following is the Dividend Discount Model (DDM) used to price stocks:
### P_0 = \frac{d_1}{r-g} ###Assume that the assumptions of the DDM hold and that the time period is measured in years.
Which of the following is equal to the expected dividend in 3 years, ## d_3 ##?
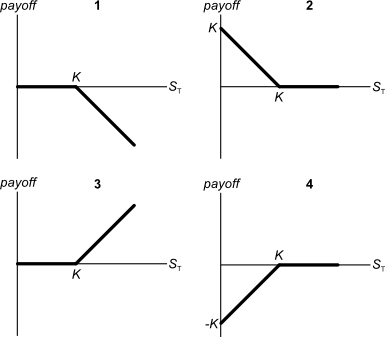
Below are 4 option graphs. Note that the y-axis is payoff at maturity (T). What options do they depict? List them in the order that they are numbered
Find Piano Bar's Cash Flow From Assets (CFFA), also known as Free Cash Flow to the Firm (FCFF), over the year ending 30th June 2013.
| Piano Bar | ||
| Income Statement for | ||
| year ending 30th June 2013 | ||
| $m | ||
| Sales | 310 | |
| COGS | 185 | |
| Operating expense | 20 | |
| Depreciation | 15 | |
| Interest expense | 10 | |
| Income before tax | 80 | |
| Tax at 30% | 24 | |
| Net income | 56 | |
| Piano Bar | ||
| Balance Sheet | ||
| as at 30th June | 2013 | 2012 |
| $m | $m | |
| Assets | ||
| Current assets | 240 | 230 |
| PPE | ||
| Cost | 420 | 400 |
| Accumul. depr. | 50 | 35 |
| Carrying amount | 370 | 365 |
| Total assets | 610 | 595 |
| Liabilities | ||
| Current liabilities | 180 | 190 |
| Non-current liabilities | 290 | 265 |
| Owners' equity | ||
| Retained earnings | 90 | 90 |
| Contributed equity | 50 | 50 |
| Total L and OE | 610 | 595 |
Note: all figures are given in millions of dollars ($m).
Which of the below statements about effective rates and annualised percentage rates (APR's) is NOT correct?
Question 497 income and capital returns, DDM, ex dividend date
A stock will pay you a dividend of $10 tonight if you buy it today. Thereafter the annual dividend is expected to grow by 5% pa, so the next dividend after the $10 one tonight will be $10.50 in one year, then in two years it will be $11.025 and so on. The stock's required return is 10% pa.
What is the stock price today and what do you expect the stock price to be tomorrow, approximately?
The perpetuity with growth formula, also known as the dividend discount model (DDM) or Gordon growth model, is appropriate for valuing a company's shares. ##P_0## is the current share price, ##C_1## is next year's expected dividend, ##r## is the total required return and ##g## is the expected growth rate of the dividend.
###P_0=\dfrac{C_1}{r-g}###
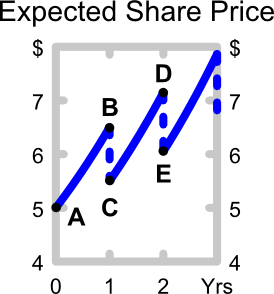
The below graph shows the expected future price path of the company's shares. Which of the following statements about the graph is NOT correct?
You are promised 20 payments of $100, where the first payment is immediate (t=0) and the last is at the end of the 19th year (t=19). The effective annual discount rate is ##r##.
Which of the following equations does NOT give the correct present value of these 20 payments?
The efficient markets hypothesis (EMH) and no-arbitrage pricing theory are most closely related to which of the following concepts?
On 1 February 2016 you were told that your refinery company will need to purchase oil on 1 July 2016. You were afraid of the oil price rising between now and then so you bought some August 2016 futures contracts on 1 February 2016 to hedge against changes in the oil price. On 1 February 2016 the oil price was $40 and the August 2016 futures price was $43.
It's now 1 July 2016 and oil price is $45 and the August 2016 futures price is $46. You bought the spot oil and closed out your futures position on 1 July 2016.
What was the effective price paid for the oil, taking into account basis risk? All spot and futures oil prices quoted above and below are per barrel.
Question 889 cross currency interest rate parity, no explanation
Judging by the graph, in 2018 the USD short term interest rate set by the US Federal Reserve is higher than the JPY short term interest rate set by the Bank of Japan, which is higher than the EUR short term interest rate set by the European central bank.
At the latest date shown in 2018: ##r_{USD}>r_{JPY}>r_{EUR}##
Assume that each currency’s yield curve is flat at the latest date shown in 2018, so interest rates are expected to remain at their current level into the future.
Which of the following statements is NOT correct?
Over time you would expect the: