The following is the Dividend Discount Model (DDM) used to price stocks:
### P_0 = \frac{d_1}{r-g} ###Assume that the assumptions of the DDM hold and that the time period is measured in years.
Which of the following is equal to the expected dividend in 3 years, ## d_3 ##?
The following table shows a sample of historical total returns of shares in two different companies A and B.
| Stock Returns | ||
| Total effective annual returns | ||
| Year | ##r_A## | ##r_B## |
| 2007 | 0.2 | 0.4 |
| 2008 | 0.04 | -0.2 |
| 2009 | -0.1 | -0.3 |
| 2010 | 0.18 | 0.5 |
What is the historical sample covariance (##\hat{\sigma}_{A,B}##) and correlation (##\rho_{A,B}##) of stock A and B's total effective annual returns?
Estimate the Chinese bank ICBC's share price using a backward-looking price earnings (PE) multiples approach with the following assumptions and figures only. Note that the renminbi (RMB) is the Chinese currency, also known as the yuan (CNY).
- The 4 major Chinese banks ICBC, China Construction Bank (CCB), Bank of China (BOC) and Agricultural Bank of China (ABC) are comparable companies;
- ICBC 's historical earnings per share (EPS) is RMB 0.74;
- CCB's backward-looking PE ratio is 4.59;
- BOC 's backward-looking PE ratio is 4.78;
- ABC's backward-looking PE ratio is also 4.78;
Note: Figures sourced from Google Finance on 25 March 2014. Share prices are from the Shanghai stock exchange.
Find Ching-A-Lings Corporation's Cash Flow From Assets (CFFA), also known as Free Cash Flow to the Firm (FCFF), over the year ending 30th June 2013.
| Ching-A-Lings Corp | ||
| Income Statement for | ||
| year ending 30th June 2013 | ||
| $m | ||
| Sales | 100 | |
| COGS | 20 | |
| Depreciation | 20 | |
| Rent expense | 11 | |
| Interest expense | 19 | |
| Taxable Income | 30 | |
| Taxes at 30% | 9 | |
| Net income | 21 | |
| Ching-A-Lings Corp | ||
| Balance Sheet | ||
| as at 30th June | 2013 | 2012 |
| $m | $m | |
| Inventory | 49 | 38 |
| Trade debtors | 14 | 2 |
| Rent paid in advance | 5 | 5 |
| PPE | 400 | 400 |
| Total assets | 468 | 445 |
| Trade creditors | 4 | 10 |
| Bond liabilities | 200 | 190 |
| Contributed equity | 145 | 145 |
| Retained profits | 119 | 100 |
| Total L and OE | 468 | 445 |
Note: All figures are given in millions of dollars ($m).
The cash flow from assets was:
One formula for calculating a levered firm's free cash flow (FFCF, or CFFA) is to use earnings before interest and tax (EBIT).
###\begin{aligned} FFCF &= (EBIT)(1-t_c) + Depr - CapEx -\Delta NWC + IntExp.t_c \\ &= (Rev - COGS - Depr - FC)(1-t_c) + Depr - CapEx -\Delta NWC + IntExp.t_c \\ \end{aligned} \\###
Which one of the below statements about effective rates and annualised percentage rates (APR's) is NOT correct?
A stock has a beta of 1.5. The market's expected total return is 10% pa and the risk free rate is 5% pa, both given as effective annual rates.
Over the last year, bad economic news was released showing a higher chance of recession. Over this time the share market fell by 1%. So ##r_{m} = (P_{0} - P_{-1})/P_{-1} = -0.01##, where the current time is zero and one year ago is time -1. The risk free rate was unchanged.
What do you think was the stock's historical return over the last year, given as an effective annual rate?
Question 785 fixed for floating interest rate swap, non-intermediated swap
The below table summarises the borrowing costs confronting two companies A and B.
| Bond Market Yields | ||||
| Fixed Yield to Maturity (%pa) | Floating Yield (%pa) | |||
| Firm A | 3 | L - 0.4 | ||
| Firm B | 5 | L + 1 | ||
Firm A wishes to borrow at a floating rate and Firm B wishes to borrow at a fixed rate. Design a non-intermediated swap that benefits firm A only. What will be the swap rate?
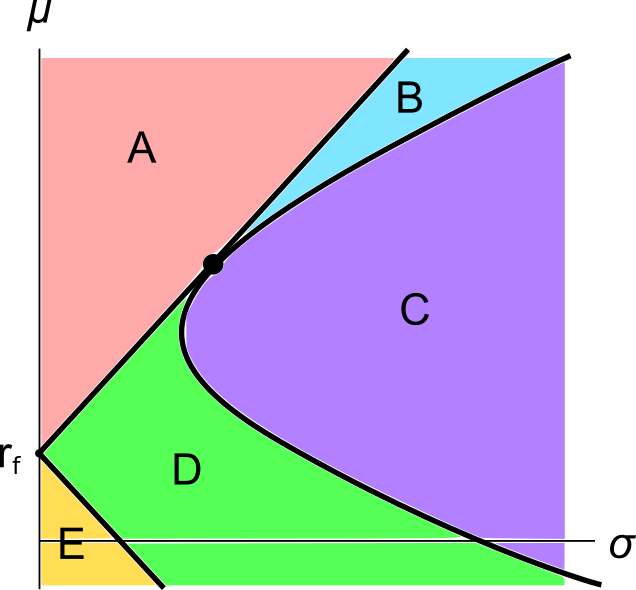
A graph of assets’ expected returns ##(\mu)## versus standard deviations ##(\sigma)## is given in the below diagram.
Each letter corresponds to a separate coloured area. The portfolios at the boundary of the areas, on the black lines, are excluded from each area. Assume that all assets represented in this graph are fairly priced, and that all risky assets can be short-sold.
Which of the following statements about this graph and Markowitz portfolio theory is NOT correct?
A Malaysian man wishes to convert 1 million Malaysian Ringgit (MYR) into Indian Rupees (IND). The exchange rate is 4.2 MYR per USD and 71 IND per USD. How much is the MYR 1 million worth in IND?