Question 418 capital budgeting, NPV, interest tax shield, WACC, CFFA, CAPM
| Project Data | ||
| Project life | 1 year | |
| Initial investment in equipment | $8m | |
| Depreciation of equipment per year | $8m | |
| Expected sale price of equipment at end of project | 0 | |
| Unit sales per year | 4m | |
| Sale price per unit | $10 | |
| Variable cost per unit | $5 | |
| Fixed costs per year, paid at the end of each year | $2m | |
| Interest expense in first year (at t=1) | $0.562m | |
| Corporate tax rate | 30% | |
| Government treasury bond yield | 5% | |
| Bank loan debt yield | 9% | |
| Market portfolio return | 10% | |
| Covariance of levered equity returns with market | 0.32 | |
| Variance of market portfolio returns | 0.16 | |
| Firm's and project's debt-to-equity ratio | 50% | |
Notes
- Due to the project, current assets will increase by $6m now (t=0) and fall by $6m at the end (t=1). Current liabilities will not be affected.
Assumptions
- The debt-to-equity ratio will be kept constant throughout the life of the project. The amount of interest expense at the end of each period has been correctly calculated to maintain this constant debt-to-equity ratio.
- Millions are represented by 'm'.
- All cash flows occur at the start or end of the year as appropriate, not in the middle or throughout the year.
- All rates and cash flows are real. The inflation rate is 2% pa. All rates are given as effective annual rates.
- The project is undertaken by a firm, not an individual.
What is the net present value (NPV) of the project?
The below screenshot of Microsoft's (MSFT) details were taken from the Google Finance website on 28 Nov 2014. Some information has been deliberately blanked out.
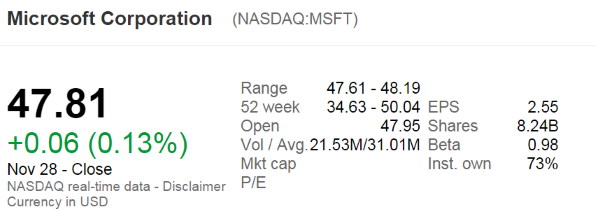
What was MSFT's backwards-looking price-earnings ratio?
An Apple iPhone 6 smart phone can be bought now for $999. An Android Samsung Galaxy 5 smart phone can be bought now for $599.
If the Samsung phone lasts for four years, approximately how long must the Apple phone last for to have the same equivalent annual cost?
Assume that both phones have equivalent features besides their lifetimes, that both are worthless once they've outlasted their life, the discount rate is 10% pa given as an effective annual rate, and there are no extra costs or benefits from either phone.
Question 575 inflation, real and nominal returns and cash flows
You expect a nominal payment of $100 in 5 years. The real discount rate is 10% pa and the inflation rate is 3% pa. Which of the following statements is NOT correct?
Which of the following statements about futures contracts on shares is NOT correct, assuming that markets are efficient?
When an equity future is first negotiated (at t=0):
A stock's required total return will increase when its:
Question 691 continuously compounding rate, effective rate, continuously compounding rate conversion, no explanation
A bank quotes an interest rate of 6% pa with quarterly compounding. Note that another way of stating this rate is that it is an annual percentage rate (APR) compounding discretely every 3 months.
Which of the following statements about this rate is NOT correct? All percentages are given to 6 decimal places. The equivalent:
A firm wishes to raise $100 million now. The firm's current market value of equity is $300m and the market price per share is $5. They estimate that they'll be able to issue shares in a rights issue at a subscription price of $4. All answers are rounded to 6 decimal places. Ignore the time value of money and assume that all shareholders exercise their rights. Which of the following statements is NOT correct?
Below is the Australian federal government’s budget balance as a percent of GDP. Note that the columns to the right of the vertical black line were a forecast at the time. The x-axis shows financial years, so for example the 06/07 financial year represents the time period from 1 July 2006 to 30 June 2007.
Comparing the 2008/09 financial year to the previous one, the Australian federal government implemented: